Wall Section Guide: U-value, thermal lag and Glaser
This guide shows you, step by step, how to build an element (wall, roof or slab), read its U-value, summer thermal lag and the risk of interstitial condensation, and then compare two variants. The orange numbers on the images refer to the text.
1. Getting started
1Opening the studio
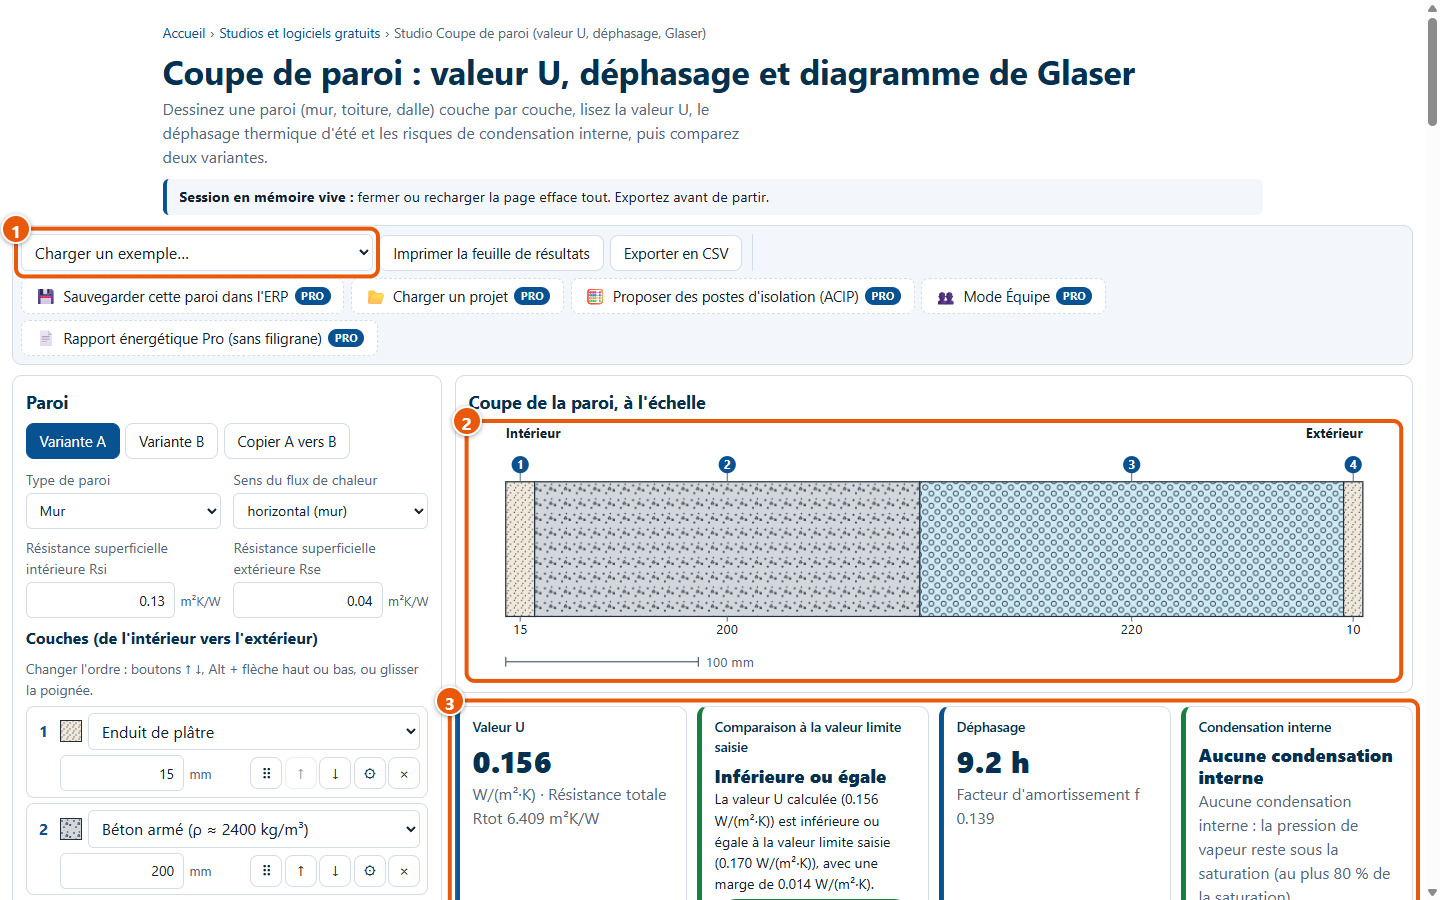
The studio runs in your browser, without an account. It opens with an initial element: the examples menu (1), the cross-section to scale (2) and the four result cards (3).
2Loading an example
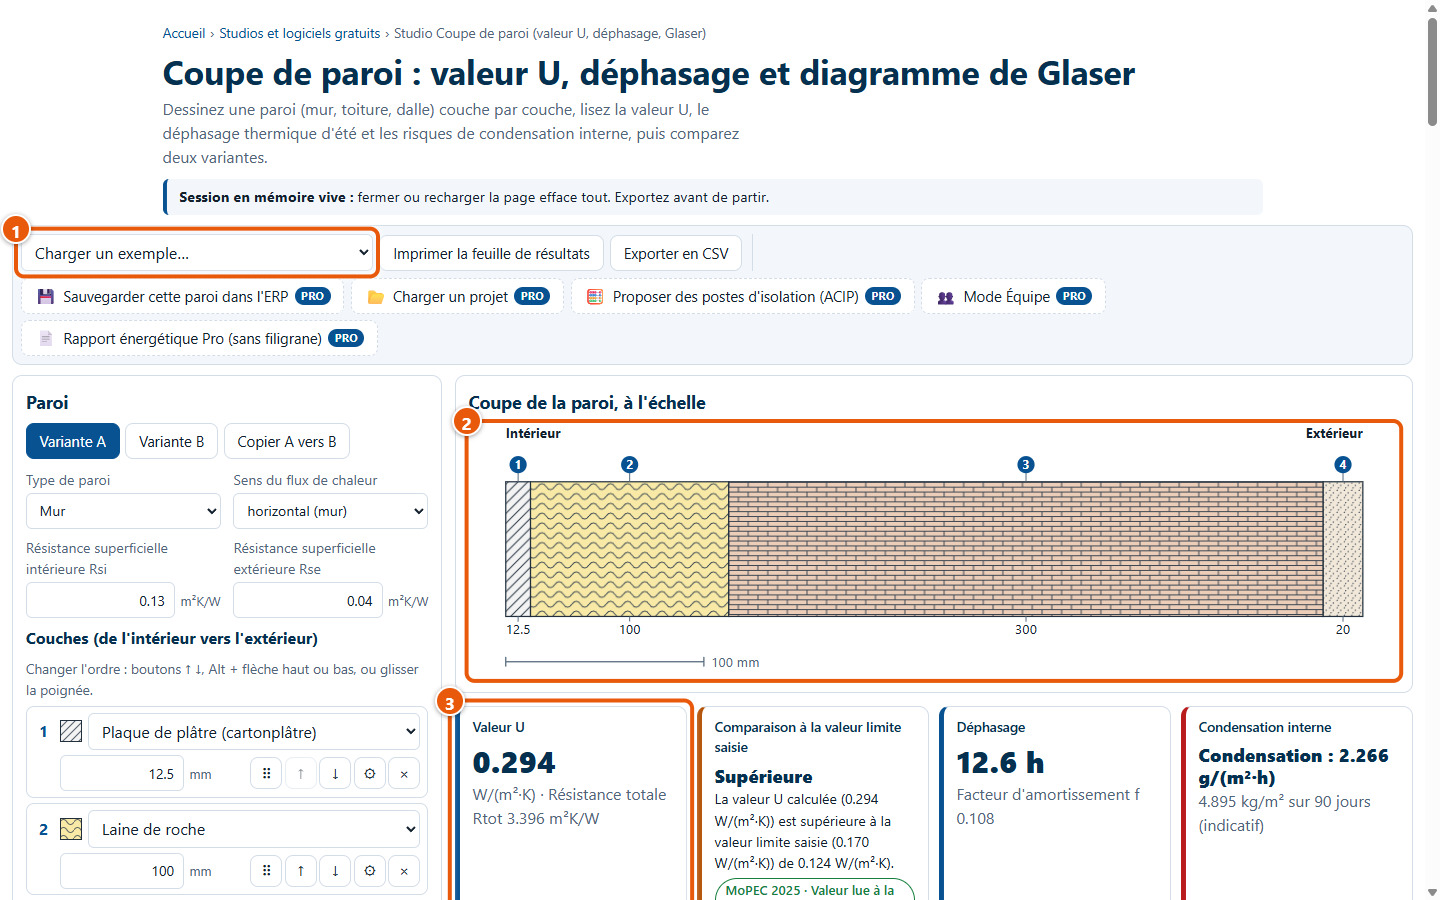
The Charger un exemple… menu (1) offers six elements: three walls, two roofs and one slab. The example replaces the element in the active variant; the section (2) and the U-value (3) update automatically.
2. Building the element
3Element type and heat flow direction
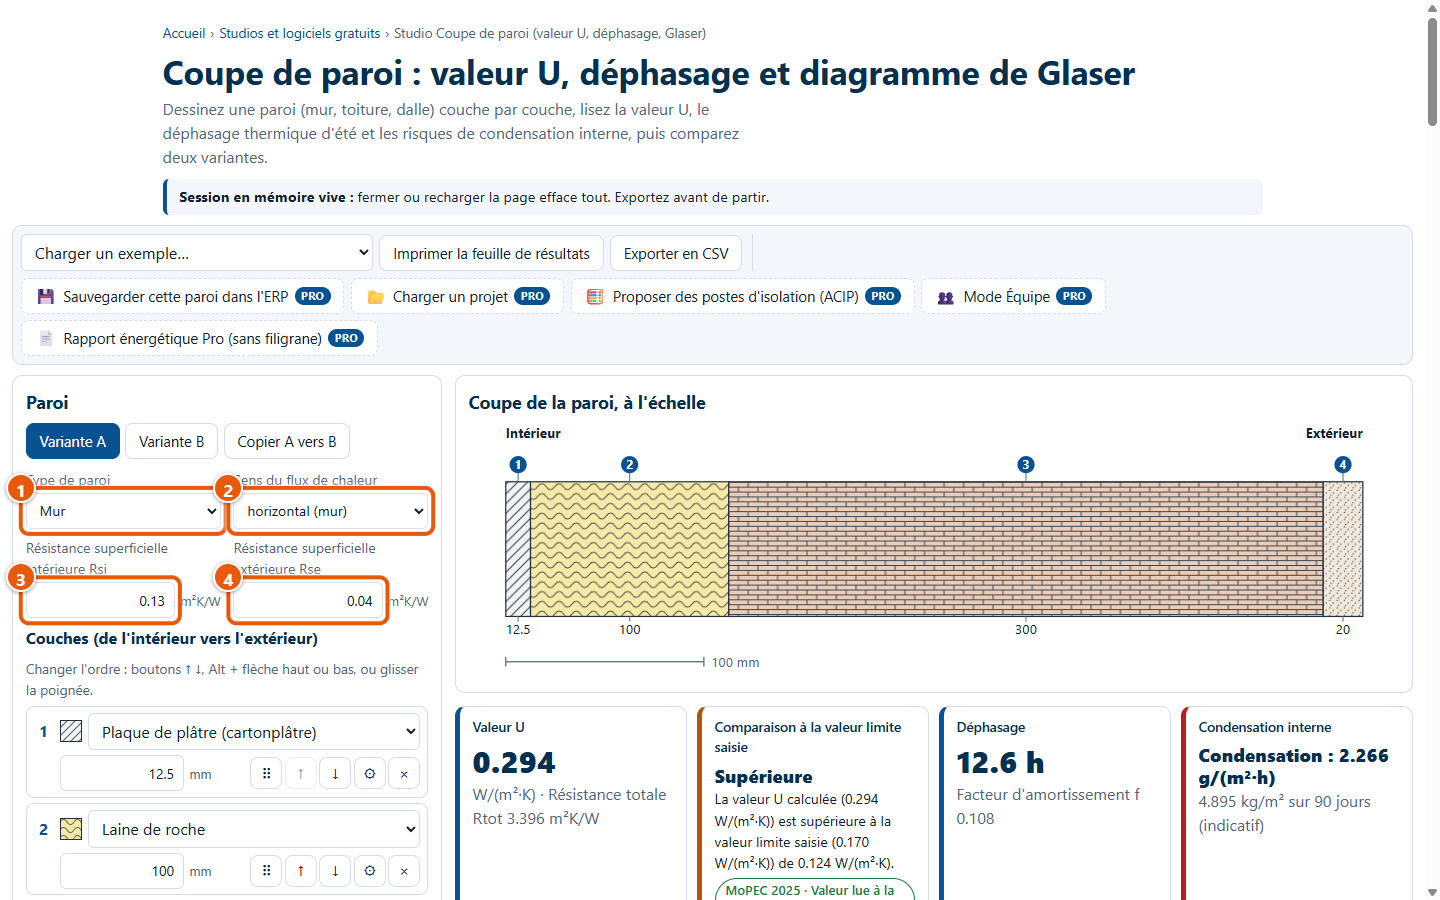
Choose the element type (1): wall, roof or slab, then the heat flow direction (2). The internal (3) and external (4) surface resistances adjust to the chosen direction and remain editable.
4The layer list
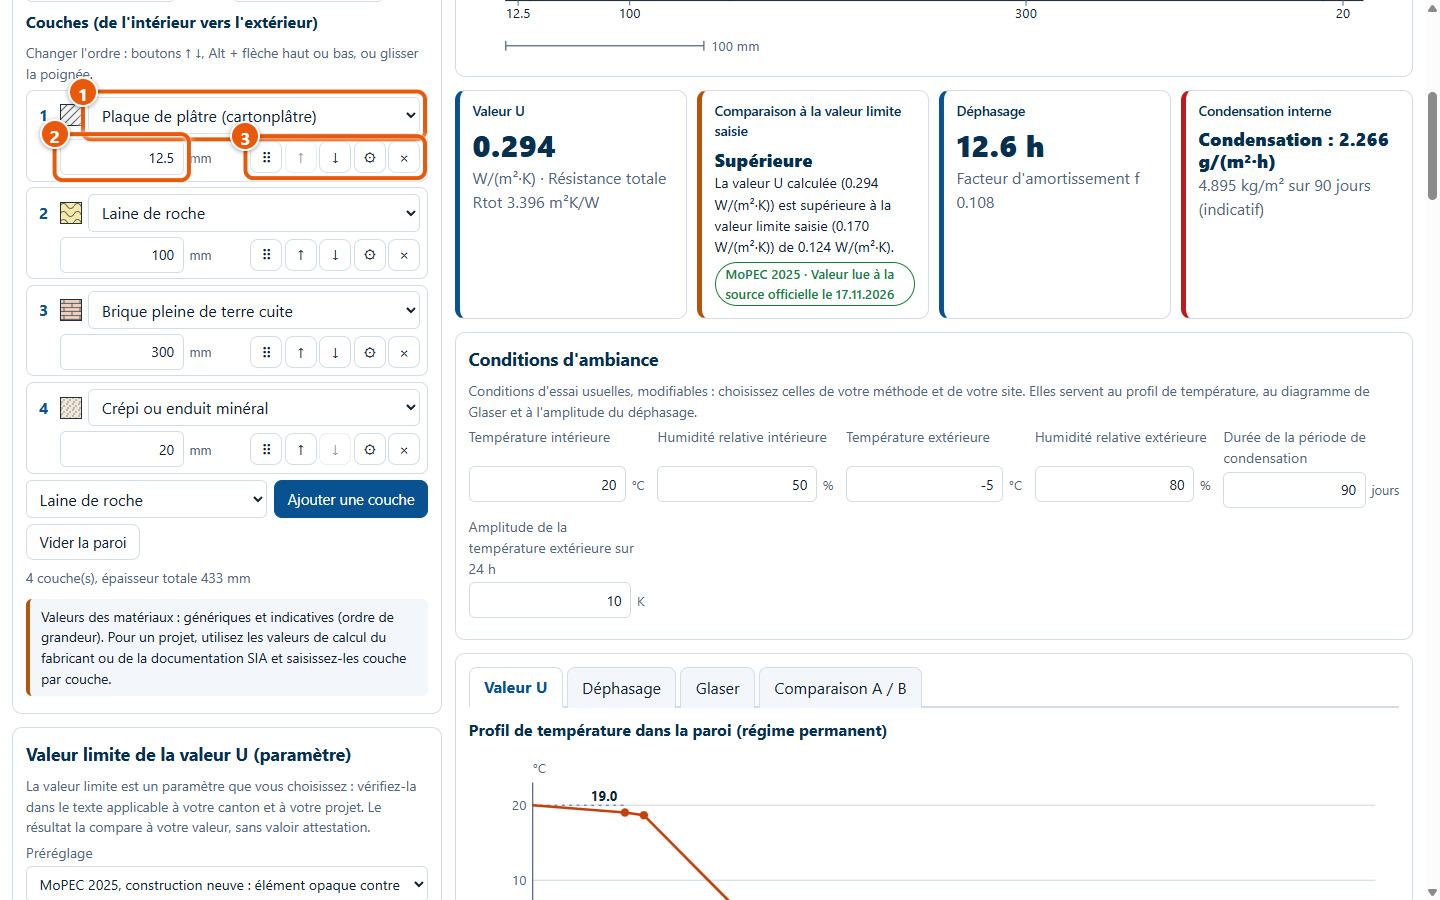
Layers are read from inside to outside. For each layer: the material (1), the thickness in millimetres (2) and its buttons (3). Twenty-six generic materials are available, and an element can have up to 30 layers.
5Adding a layer: selection
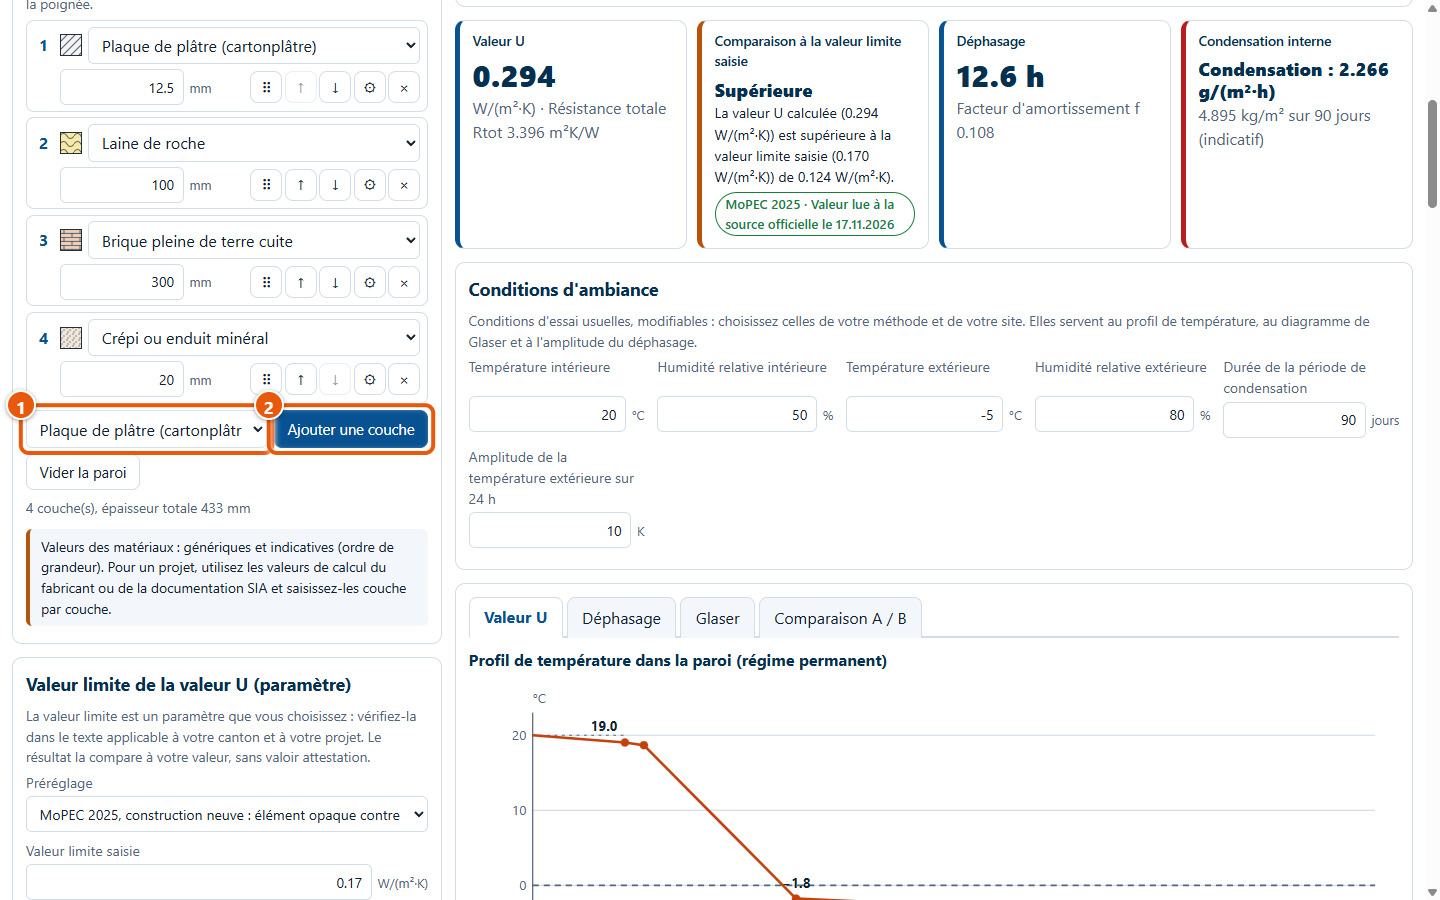
Select the material from the list (1), then click on Ajouter une couche (2).
6Adding a layer: the result
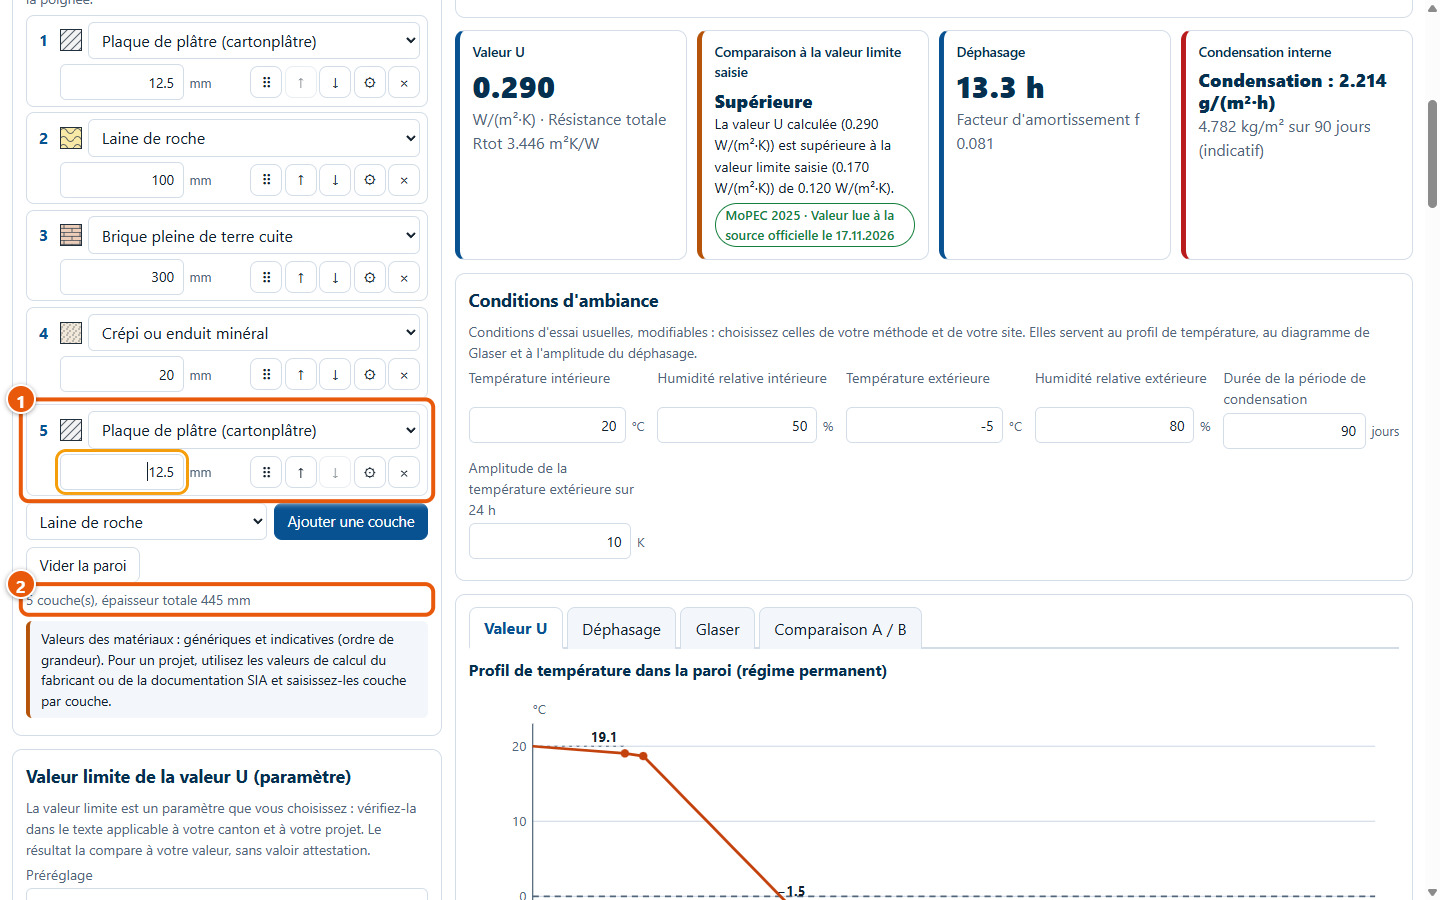
The new layer appears in the last position (1): enter its thickness. The layer count and the total thickness (2) update automatically.
7Changing the thickness
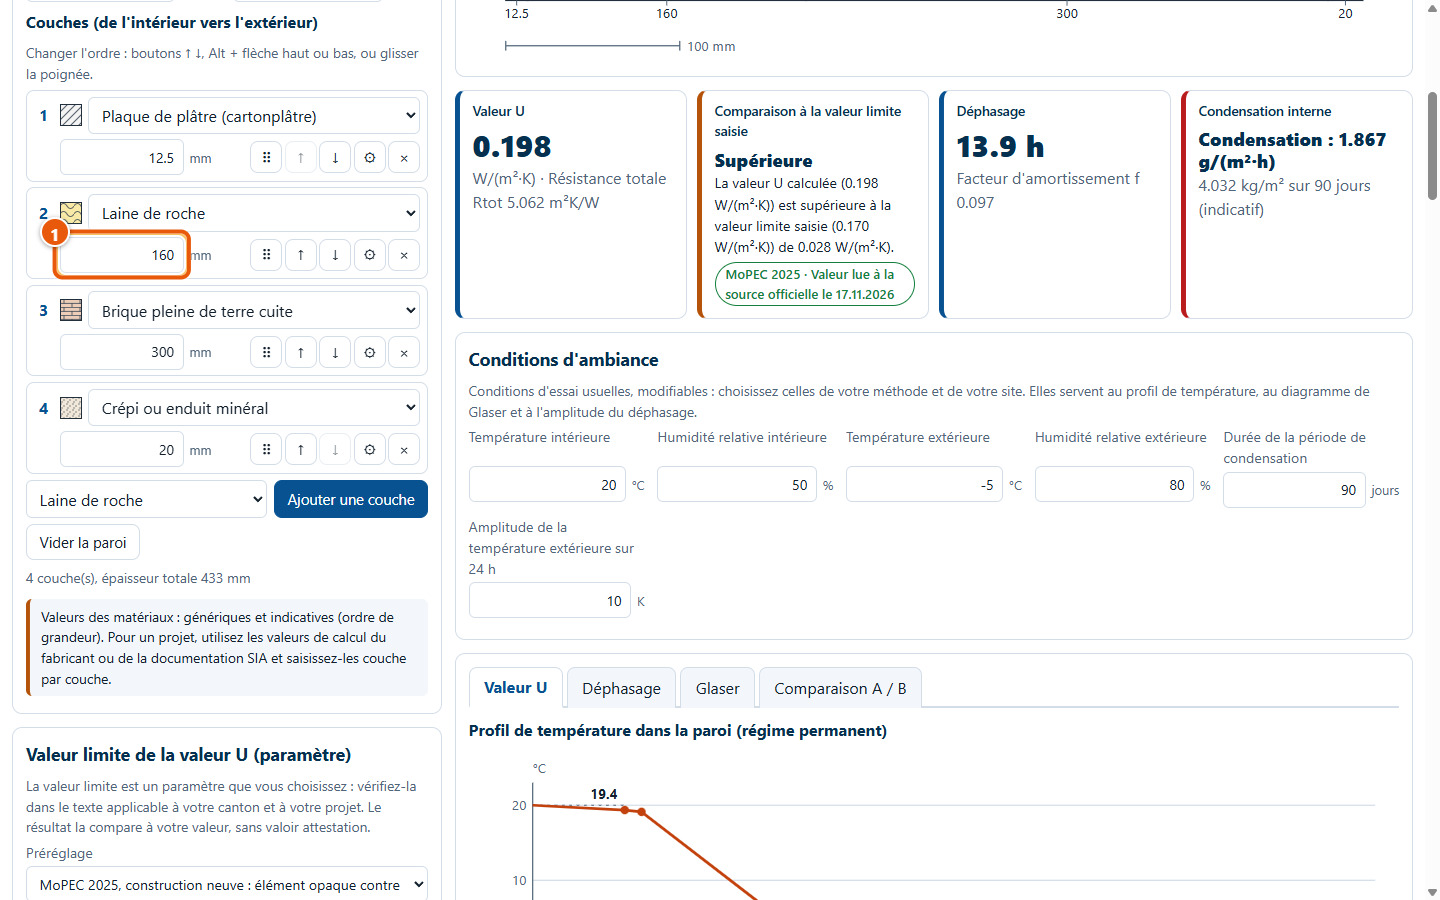
Type the new thickness in millimetres (1): the section and the results are recalculated immediately. An unreadable value or one outside the limits is flagged and the calculation is paused, never replaced by 0.
8The effect on the U-value
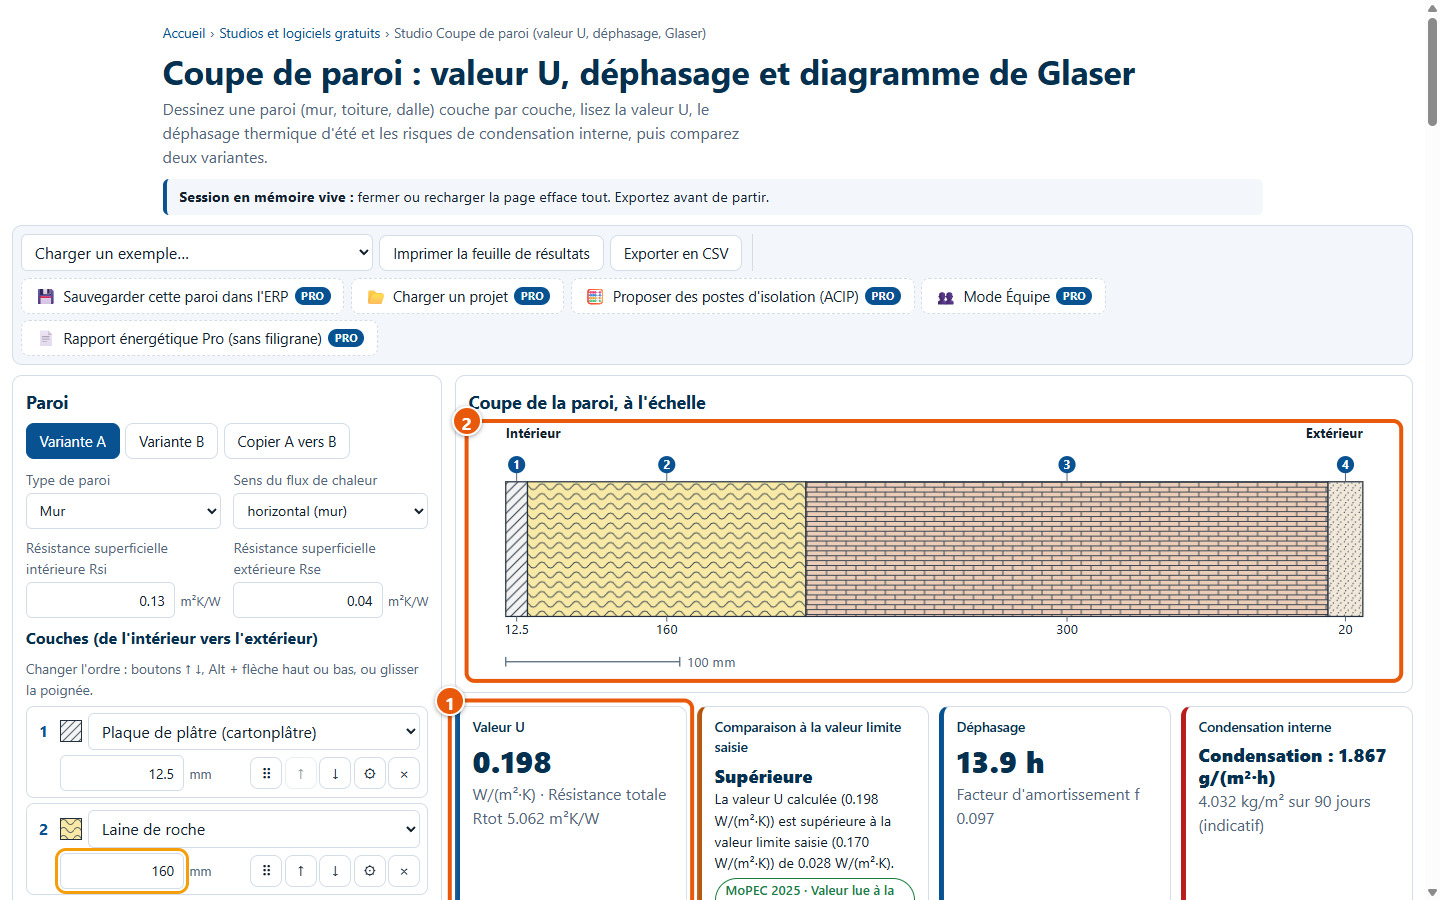
The cross-section to scale (2) and the U-value (1) update accordingly. In the example, increasing the rock wool from 100 to 160 mm changes the U-value from 0.294 to 0.198 W/(m²·K).
9Changing the order of the layers
Three ways: drag the handle (1), click on ↑ (2) or ↓ (3), or, within the layer, press Alt + up or down arrow.
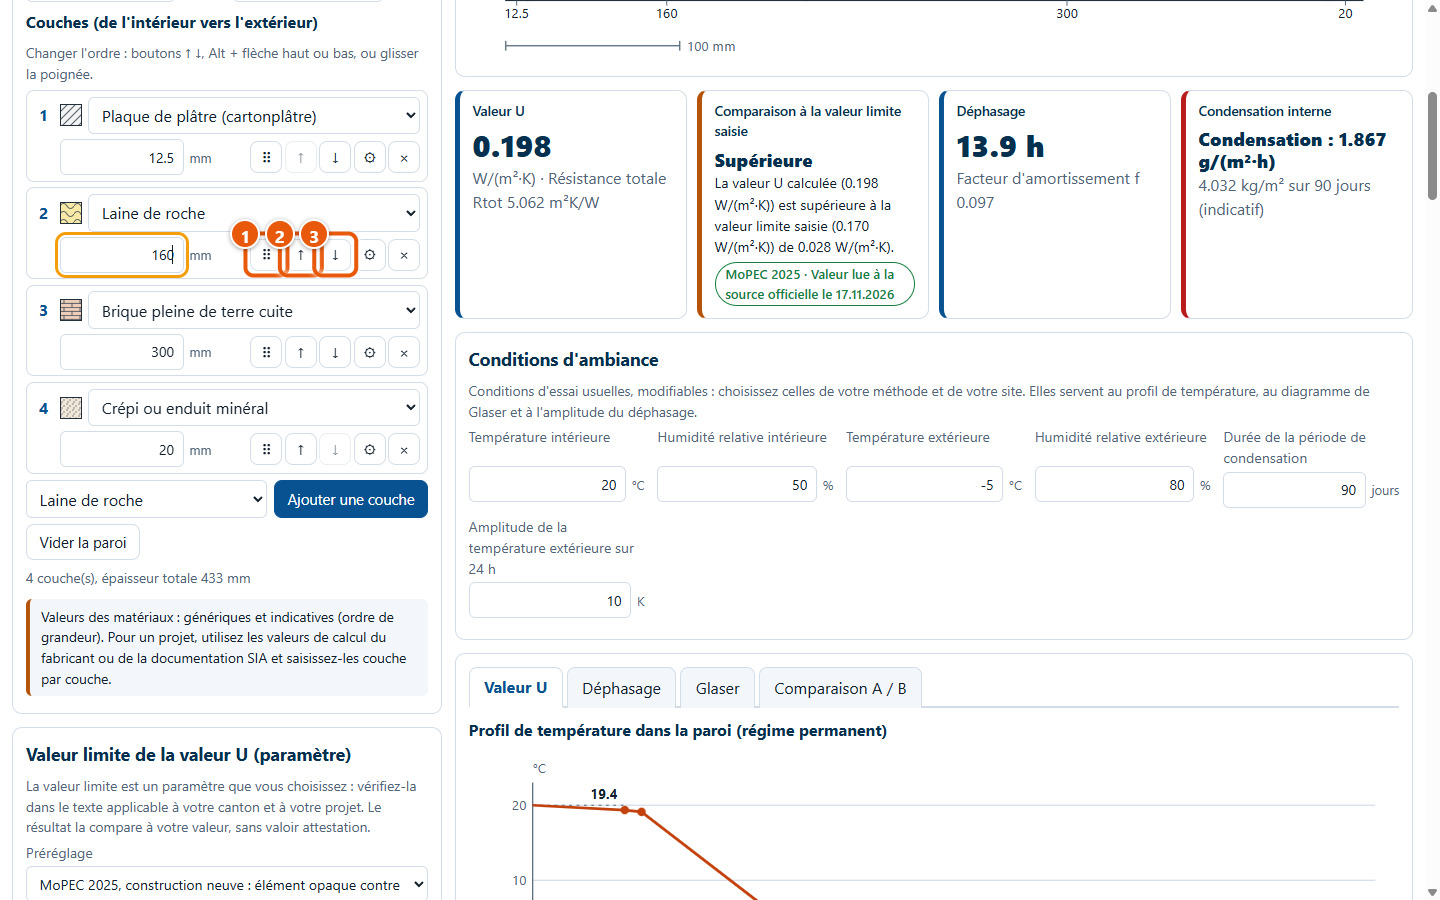
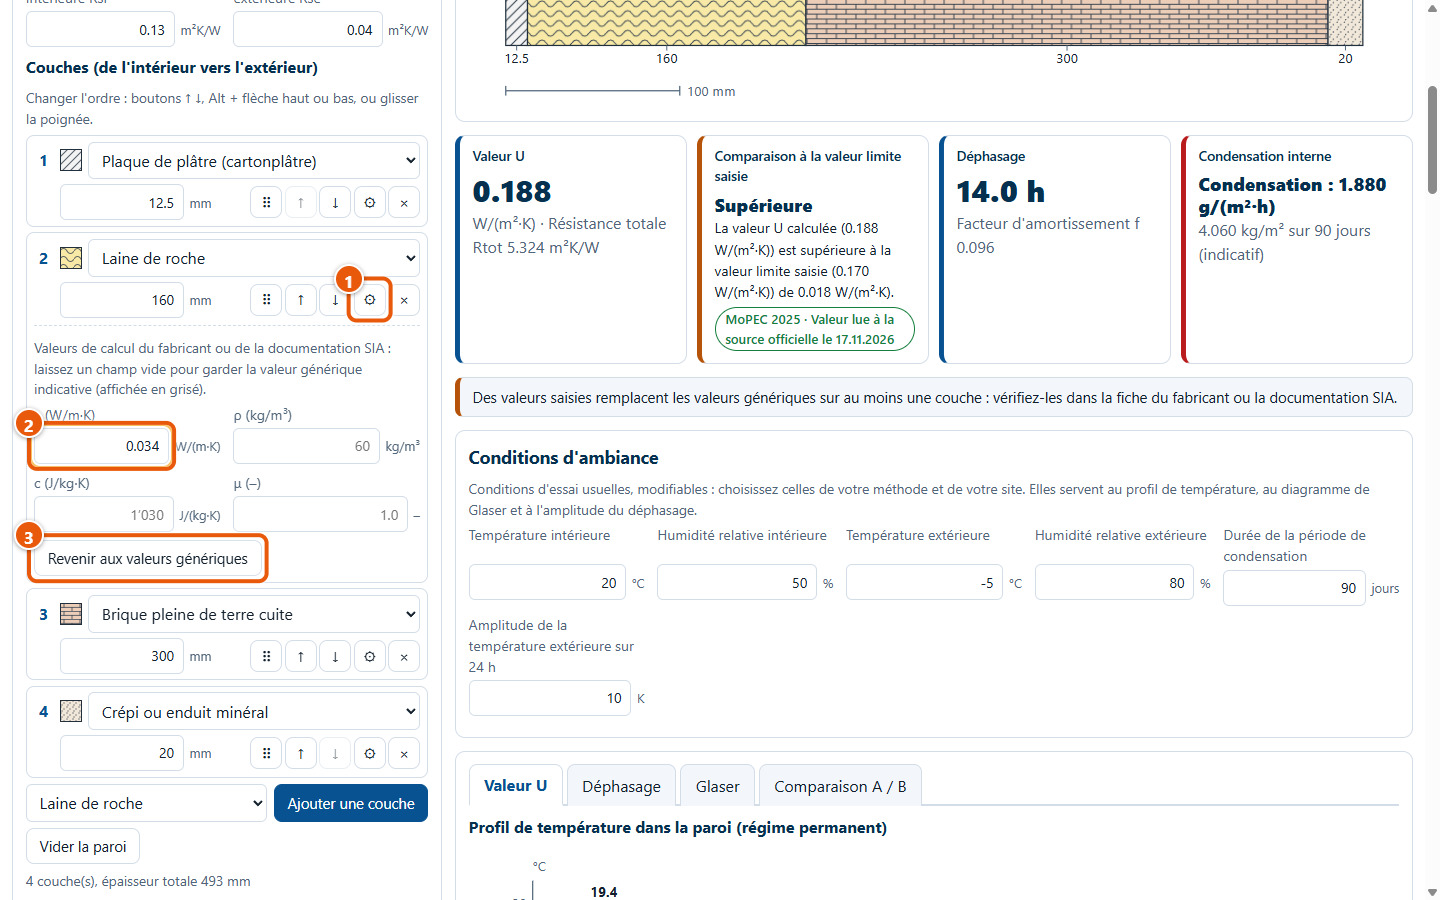
10Entering manufacturer values
The ⚙ button (1) opens the layer calculation values: thermal conductivity λ (2), density, specific heat capacity and μ-value. An empty field keeps the generic value, displayed in grey; Revenir aux valeurs génériques (3) clears your entries.
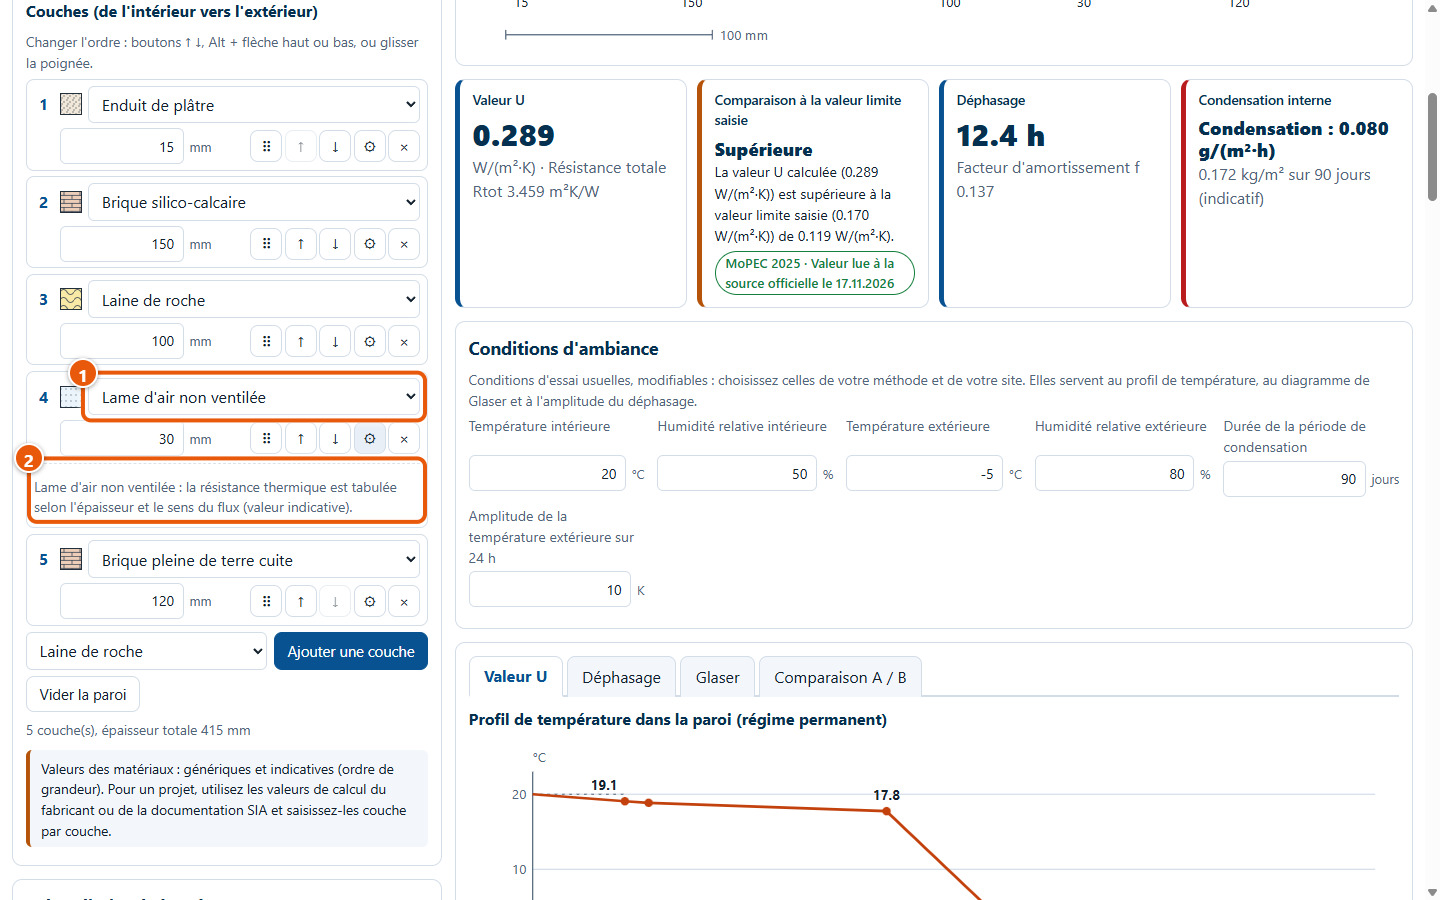
11The unventilated air cavity
Select Lame d'air non ventilée (1): its thermal resistance is tabulated according to thickness and direction of heat flow (2). A ventilated air cavity is not calculated: terminate the wall assembly at this cavity.
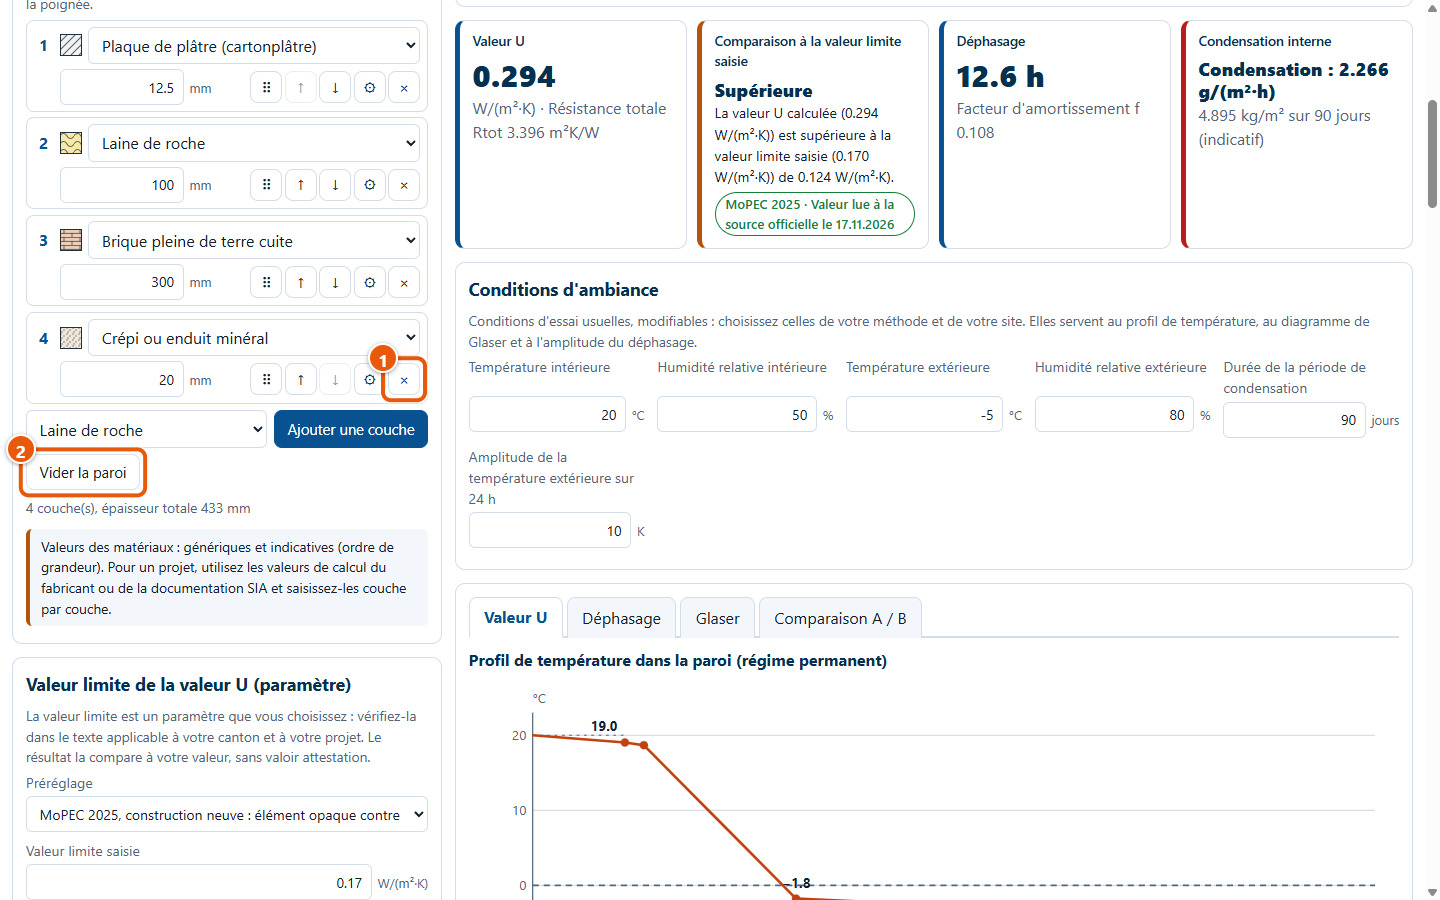
12Deleting a layer, clearing the wall assembly
The × button (1) deletes the layer. Vider la paroi (2) removes all layers.
3. Reading the cross-section and results
13The cross-section to scale
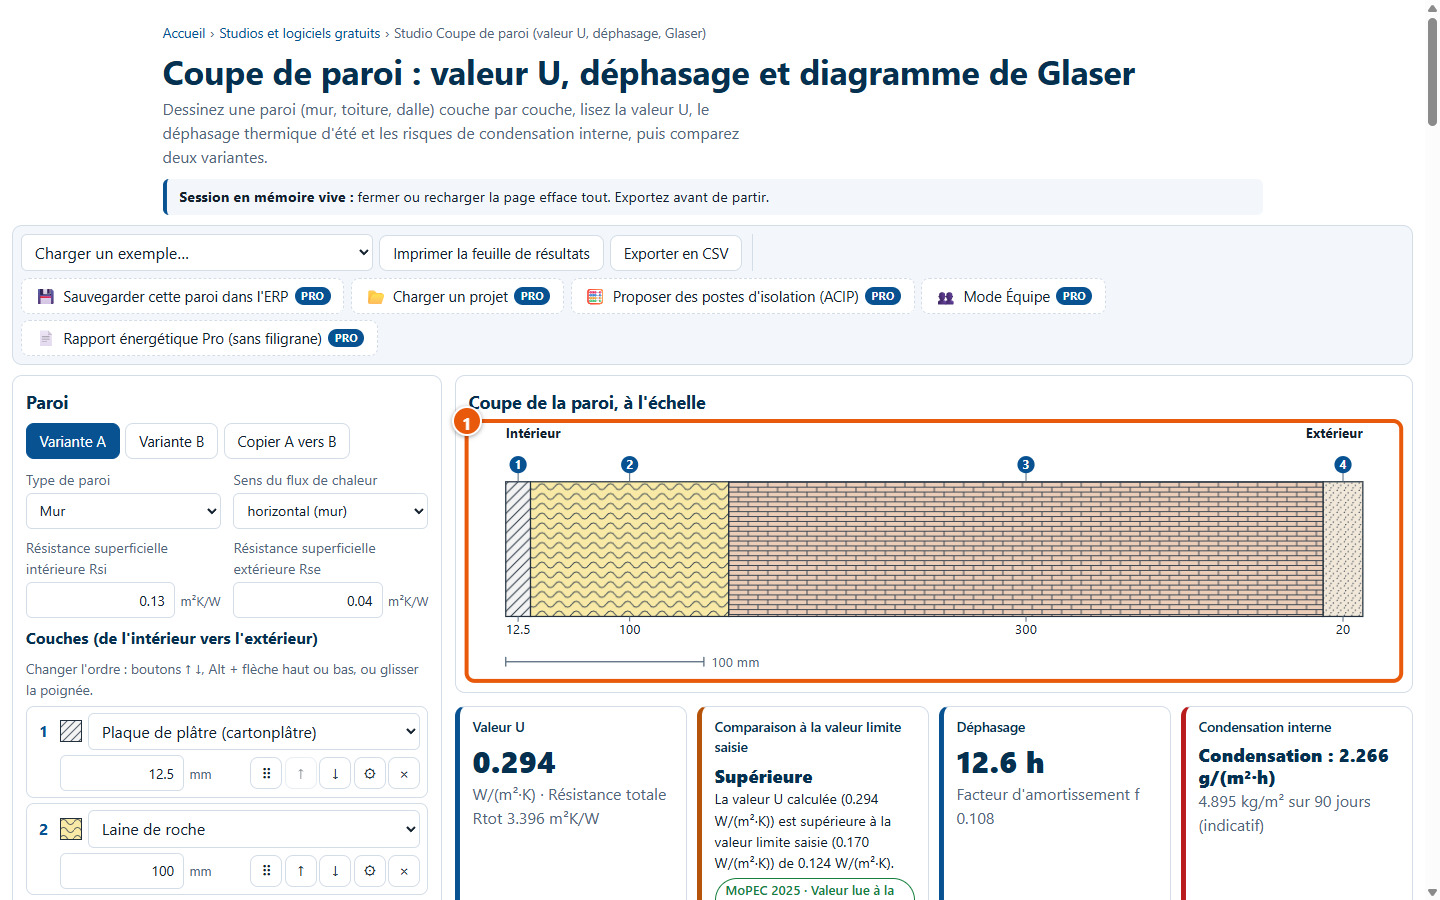
Each layer is drawn to scale (1), with hatching according to material family, its number, its thickness and a scale bar. A wall is drawn horizontally; a roof or slab, vertically.
14The four result cards
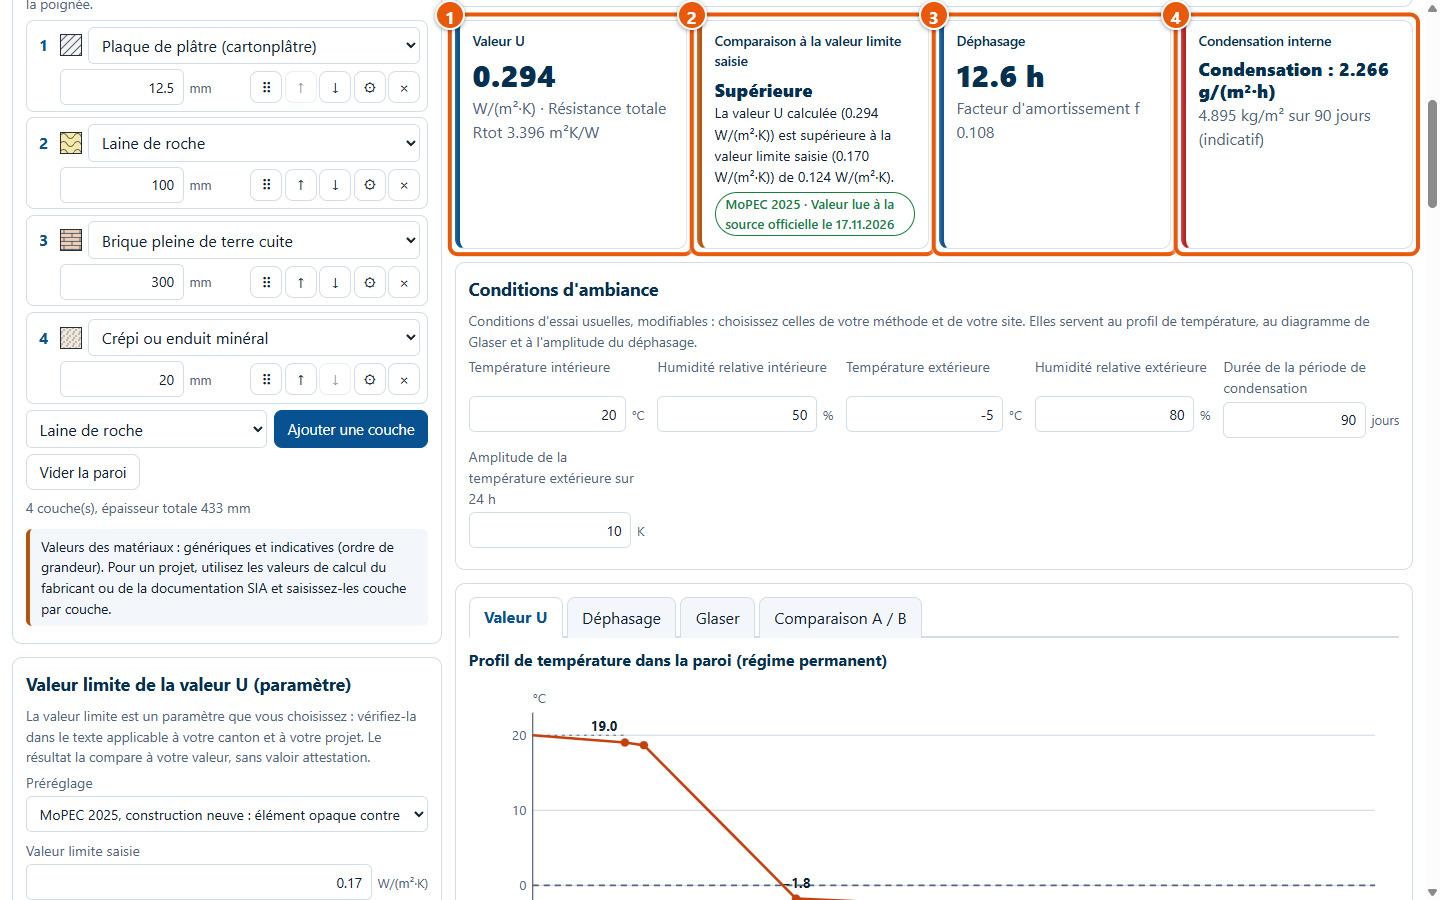
U-value and total resistance (1); comparison with the entered limit value (2); summer thermal decrement delay and decrement factor (3); interstitial condensation (4).
15The limit value
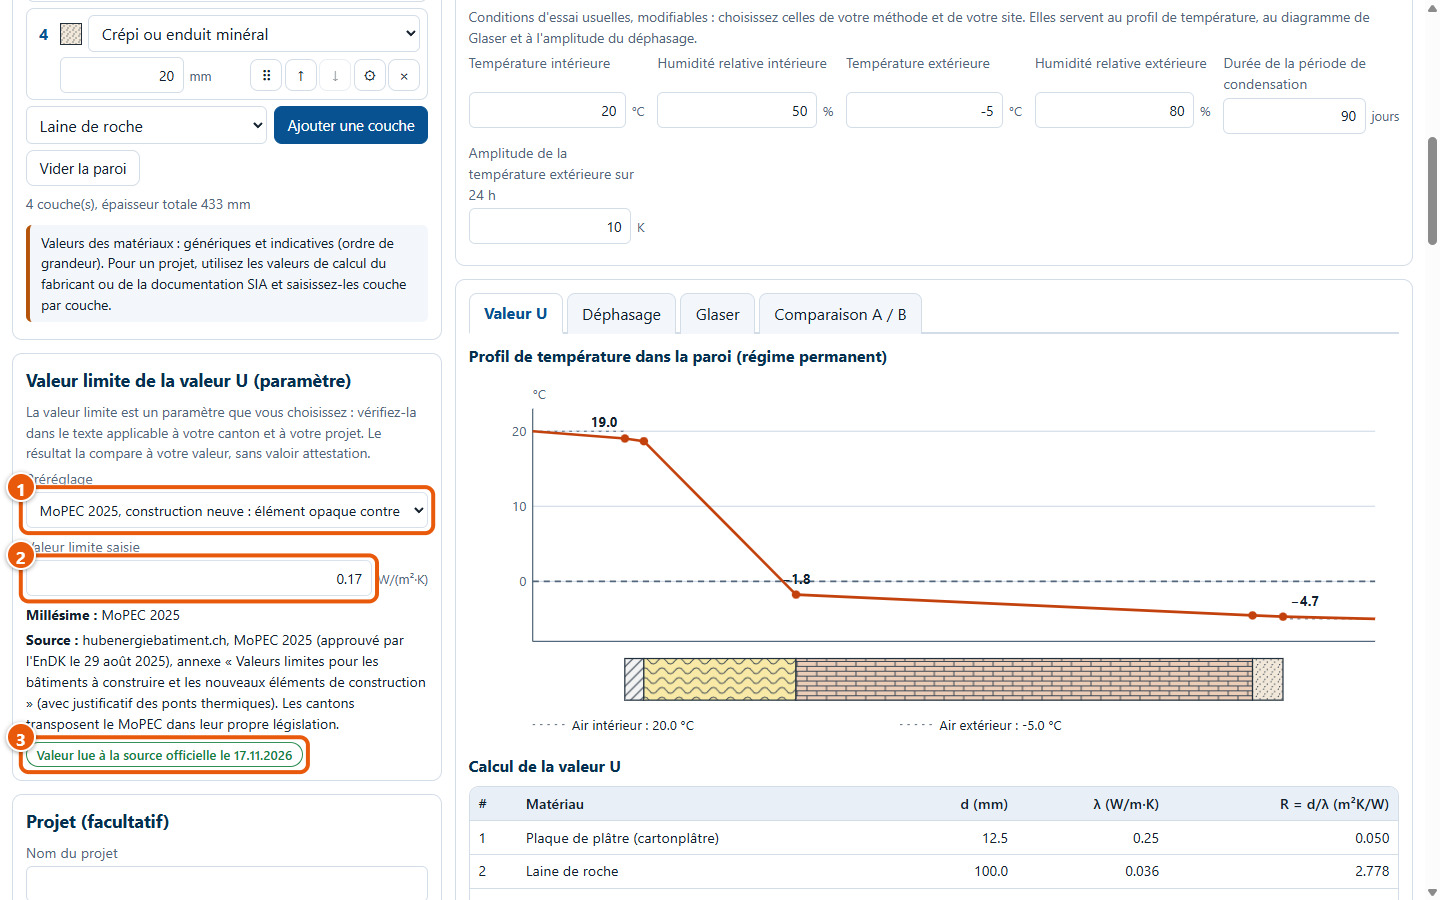
Select a preset (1) or enter your value (2). A label indicates whether the value was taken from the official source or whether it remains to be verified (3). The result only states 'lower than or equal to' or 'higher than' the entered value: this is not a certificate.
16Ambient conditions
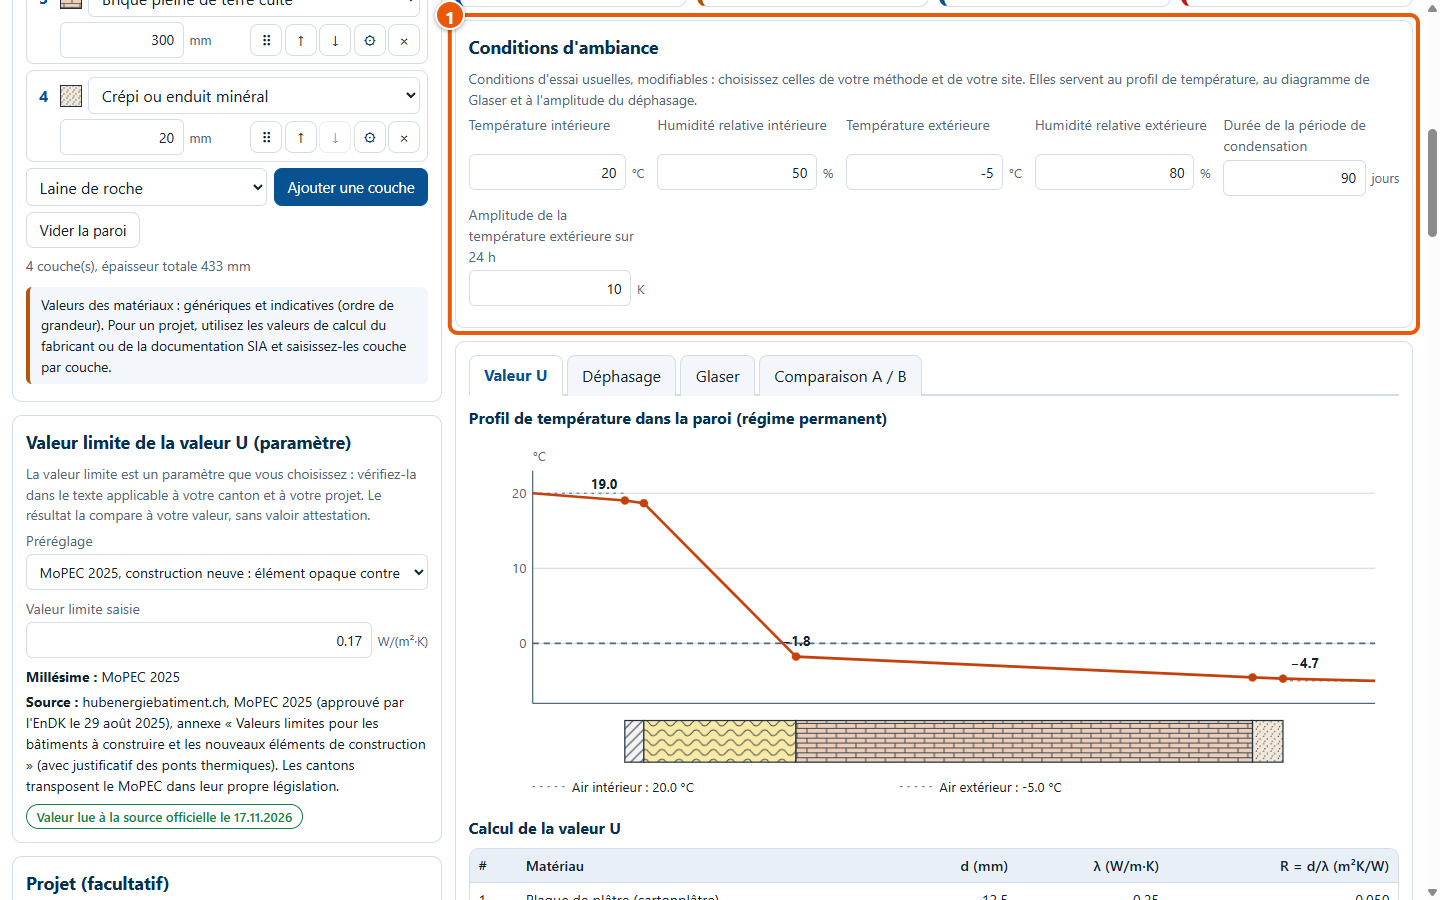
Set the indoor and outdoor temperature and humidity, the duration of the condensation period, and the outdoor temperature amplitude (1). These are standard test conditions, to be selected according to your method and your site.
4. Detailed results
17The U-value tab
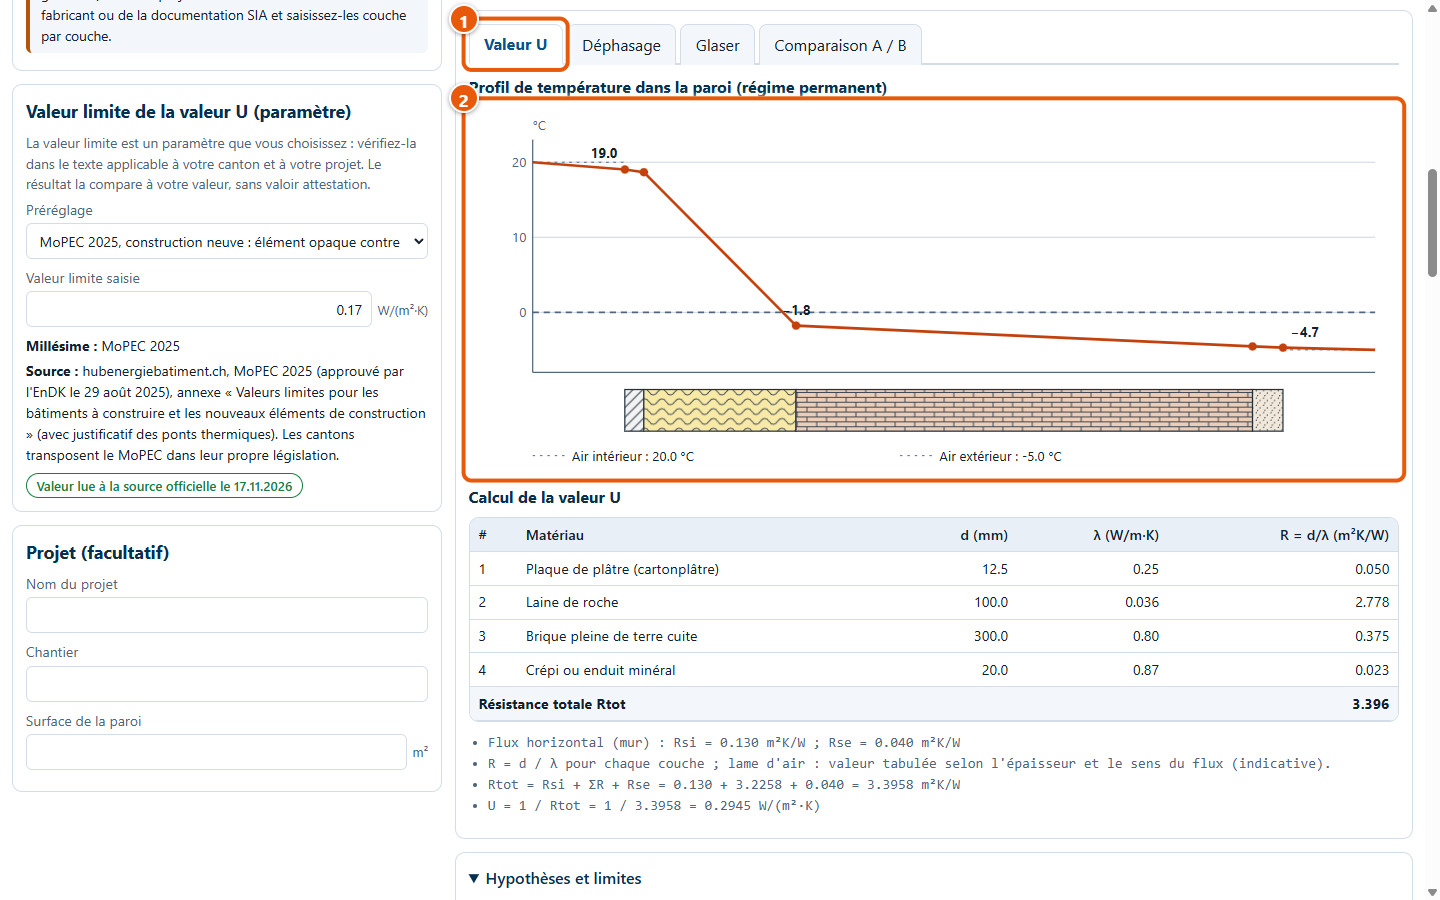
The Valeur U tab (1) displays the temperature profile through the wall (2), under steady-state conditions.
18U-value calculation
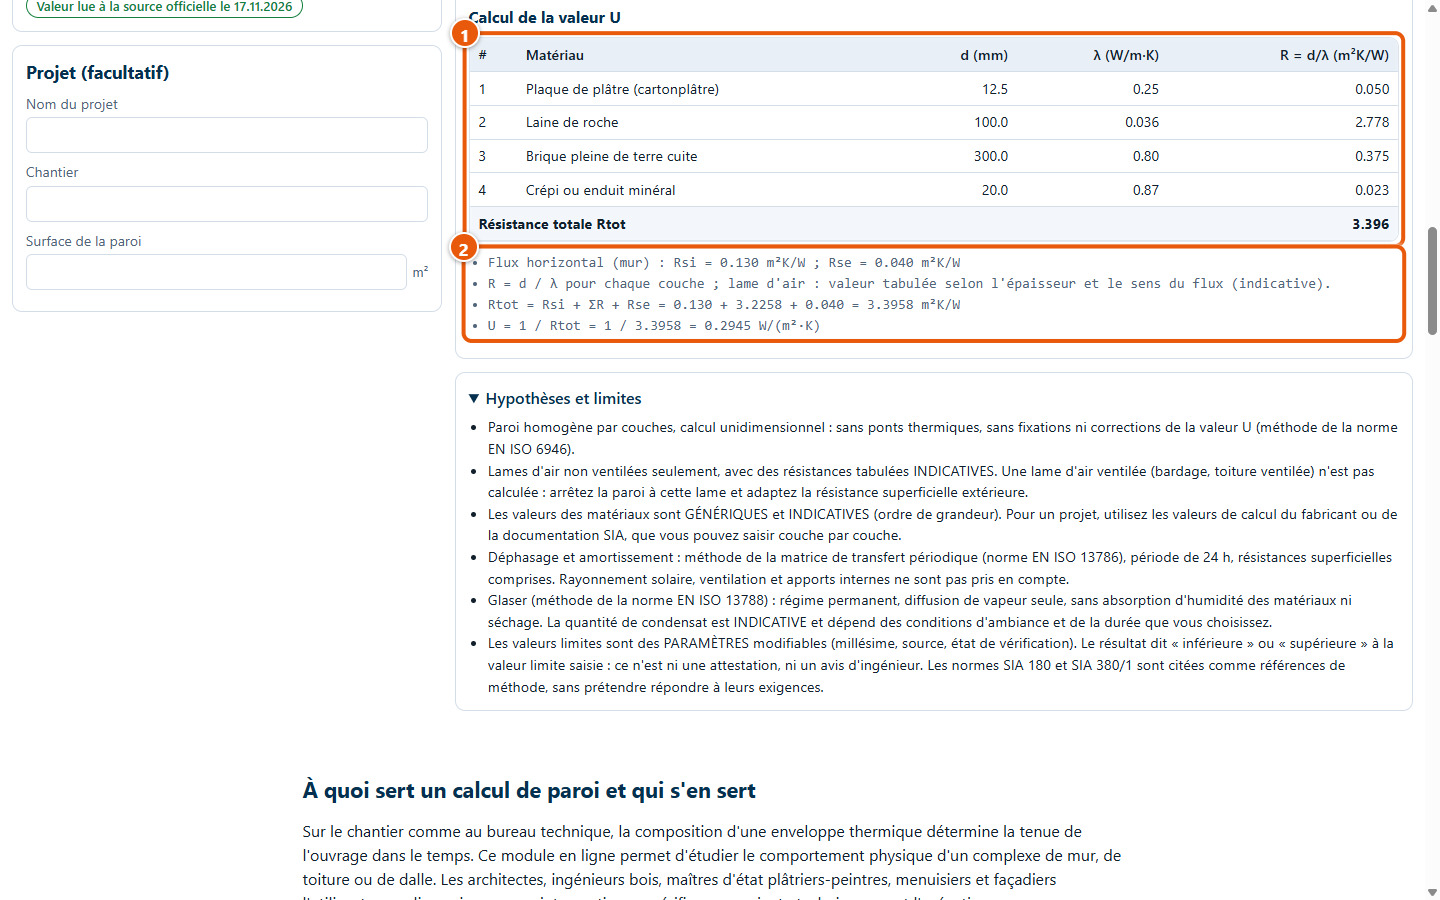
The table (1) indicates the thickness, thermal conductivity, and resistance of each layer; the formulas (2) show the total thermal resistance and then the U-value, which equals 1 divided by the total resistance.
19The Phase shift tab
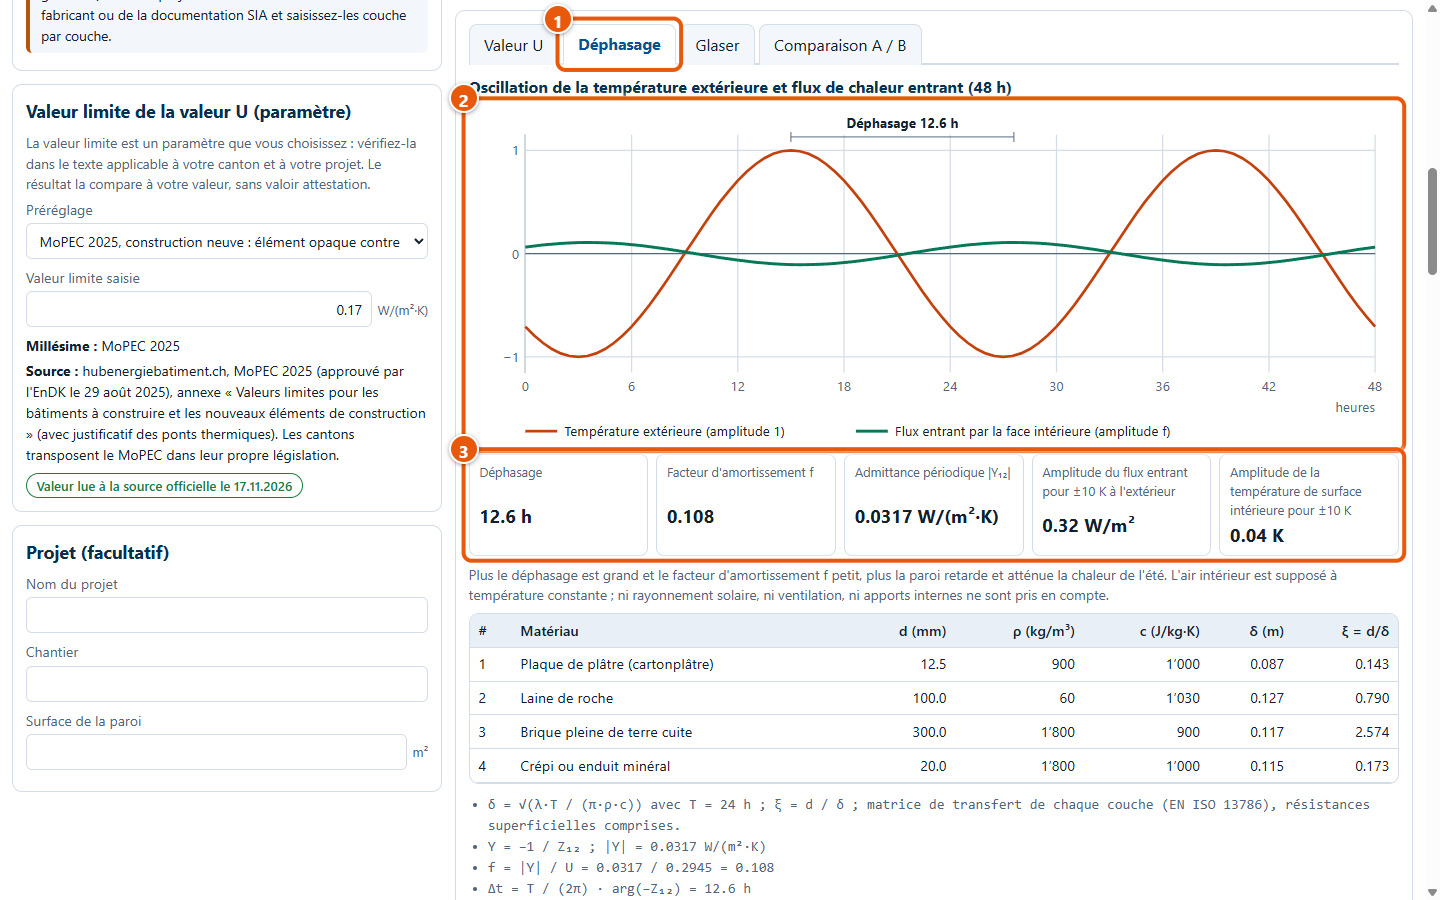
The Déphasage tab (1) displays the outdoor temperature and the incoming heat flux over 48 hours (2), followed by the phase shift, the decrement factor, and the amplitudes (3). The longer the phase shift and the lower the factor, the more the wall delays and attenuates summer heat.
20The Glaser tab
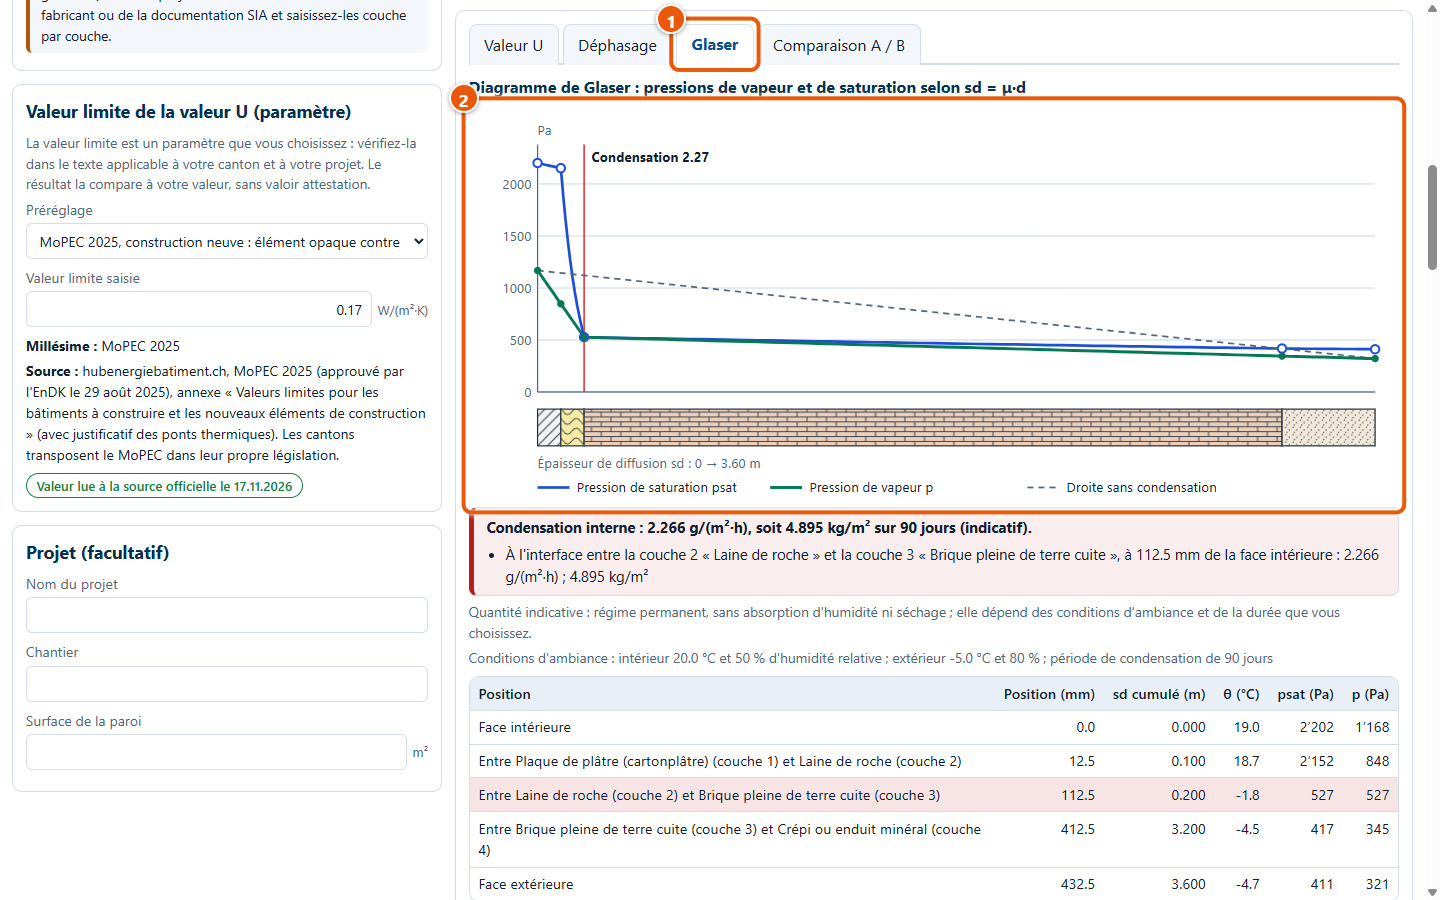
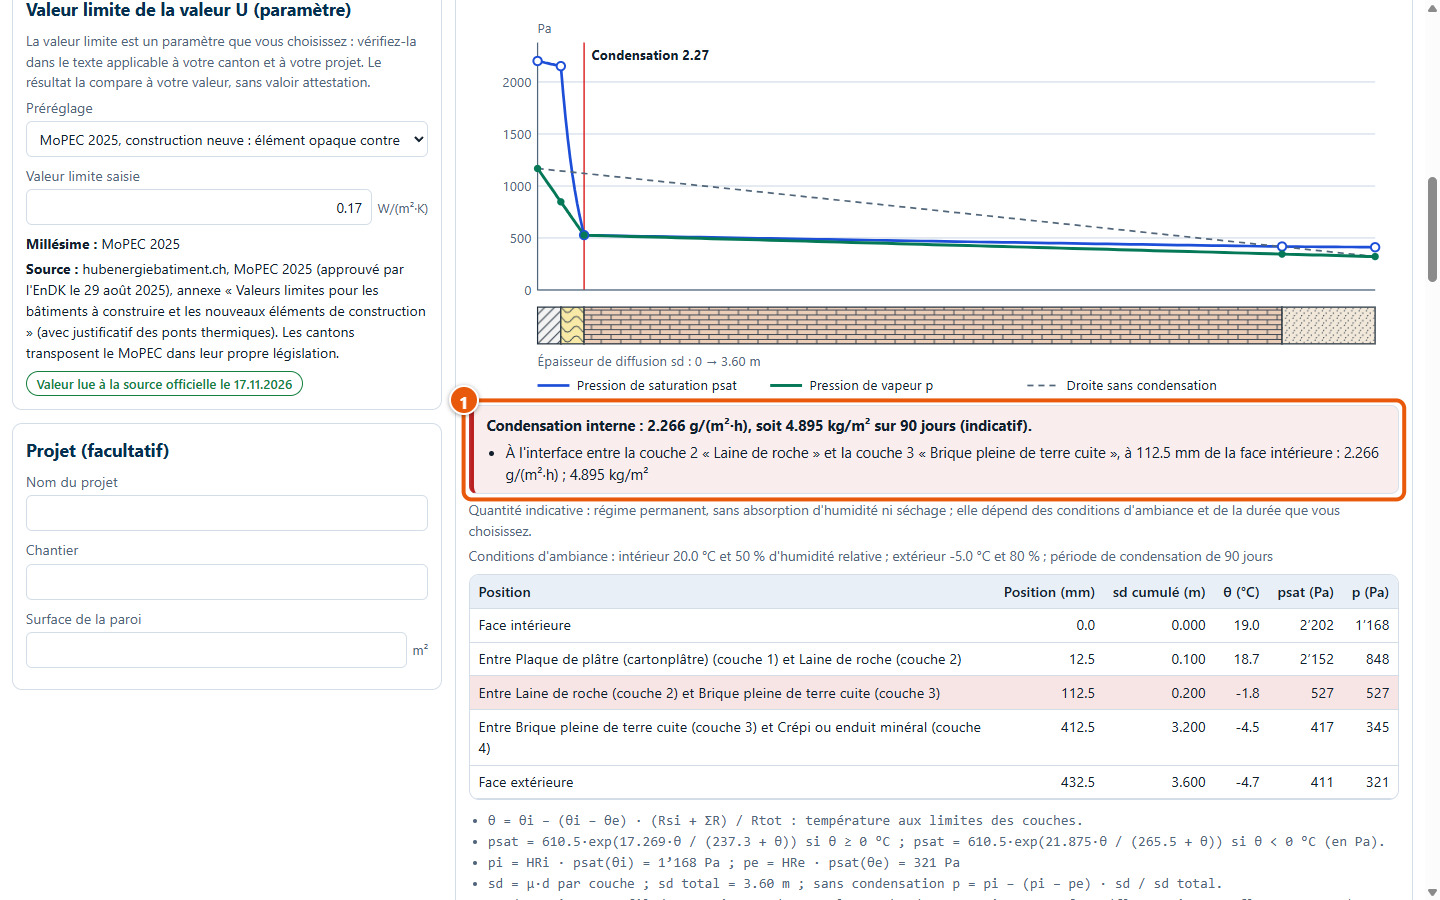
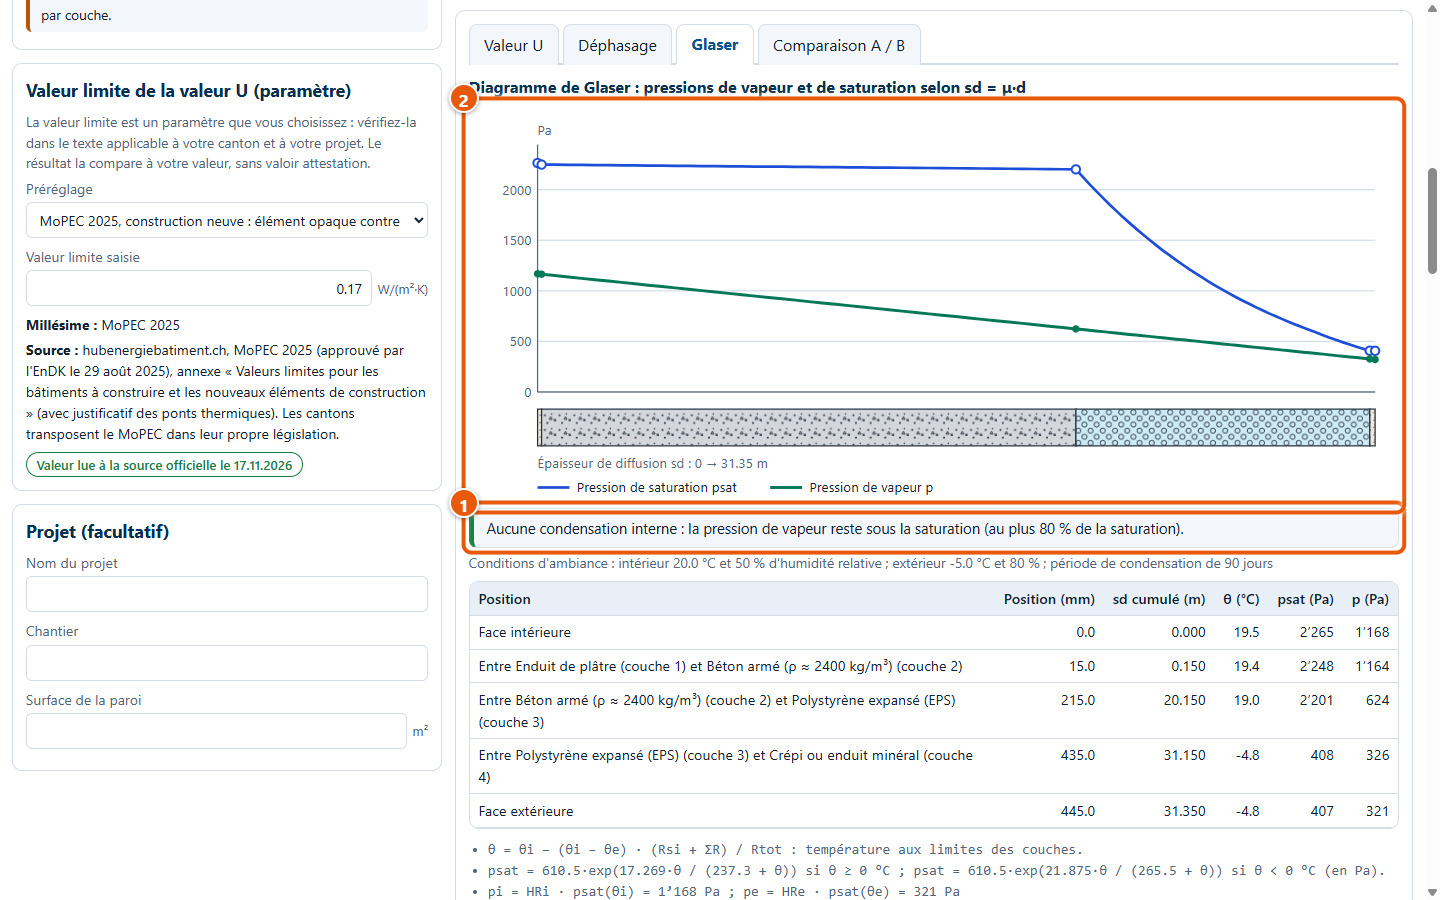
The Glaser tab (1) plots the vapour pressure and saturation vapour pressure against diffusion thickness (2). When the vapour pressure reaches saturation, interstitial condensation is indicated.
21Condensation location
The box (1) gives the indicative amount, in g/(m²·h) and in kg/m² over the selected period, and the exact location: at the interface between two layers or inside a layer. The table below lists the temperature and pressures at each layer boundary.
22When there is no condensation
The message (1) indicates that the vapour pressure remains below saturation and displays the highest ratio reached.
5. Comparing two variants
23Variant A and variant B
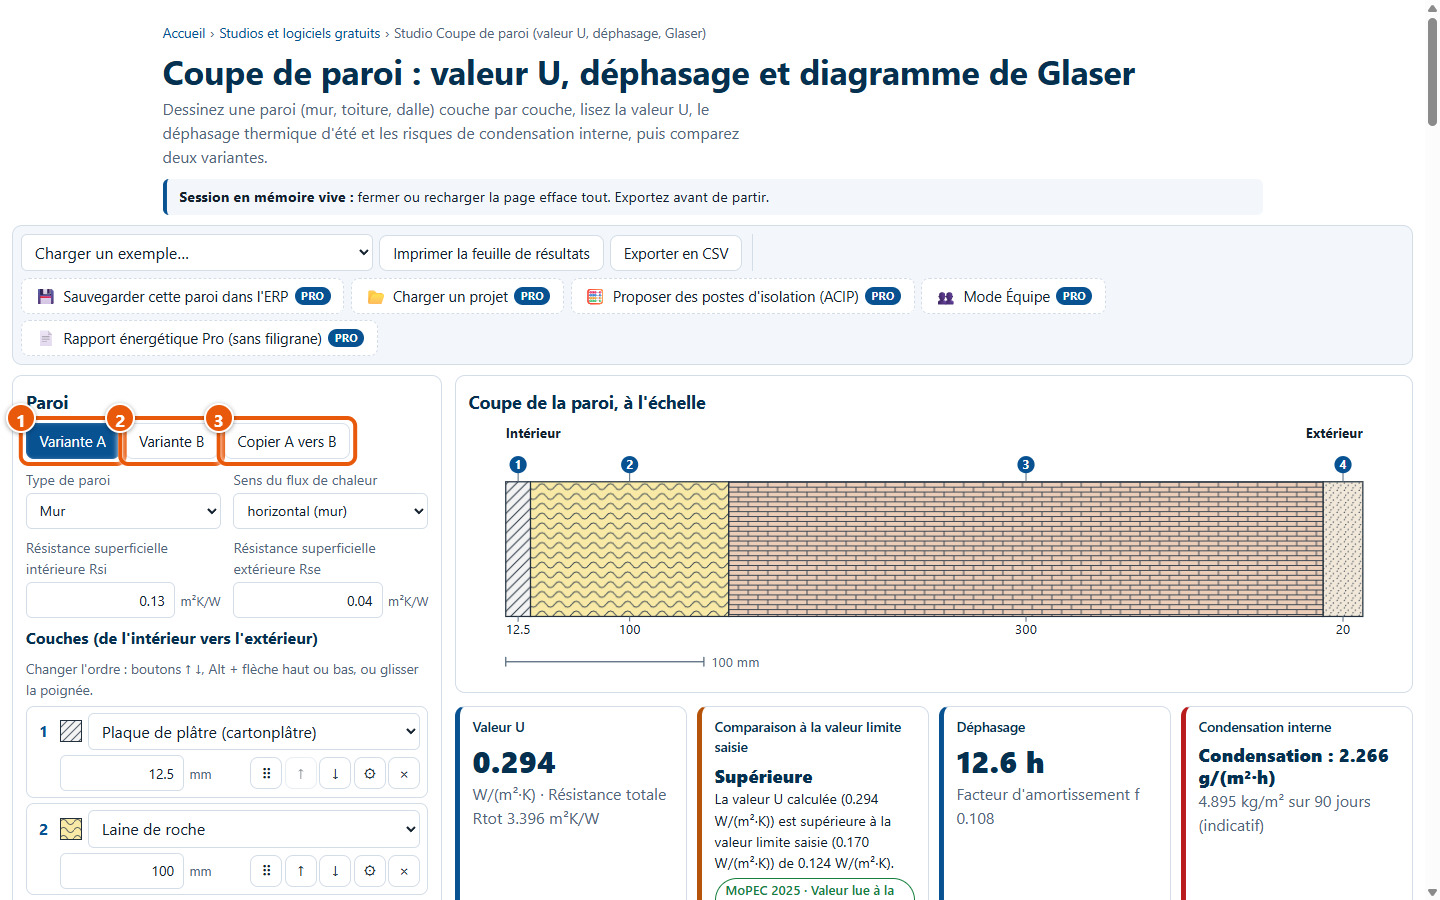
The Variante A (1) and Variante B (2) buttons select the wall you are modifying. Copier A vers B (3) copies the active variant to the other one.
24Another wall in variant B
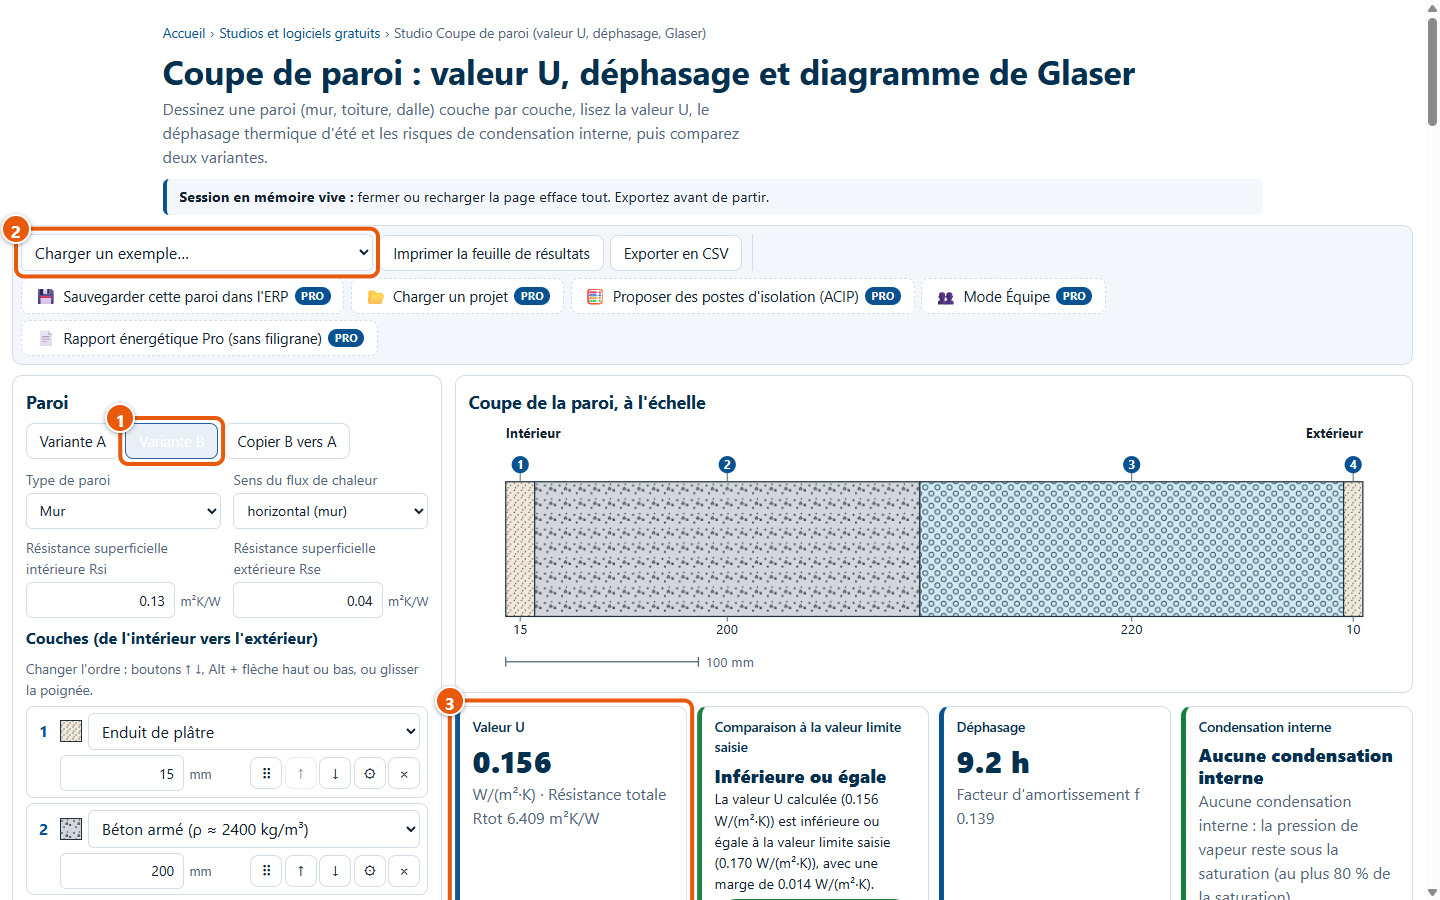
Switch to variant B (1), then load an example (2): only the active variant is replaced. The cards (3) display the results for variant B.
25The Comparison A / B tab
The Comparaison A / B tab (1) displays both cross-sections side by side (2). Both variants share the same ambient conditions and the same limit value.
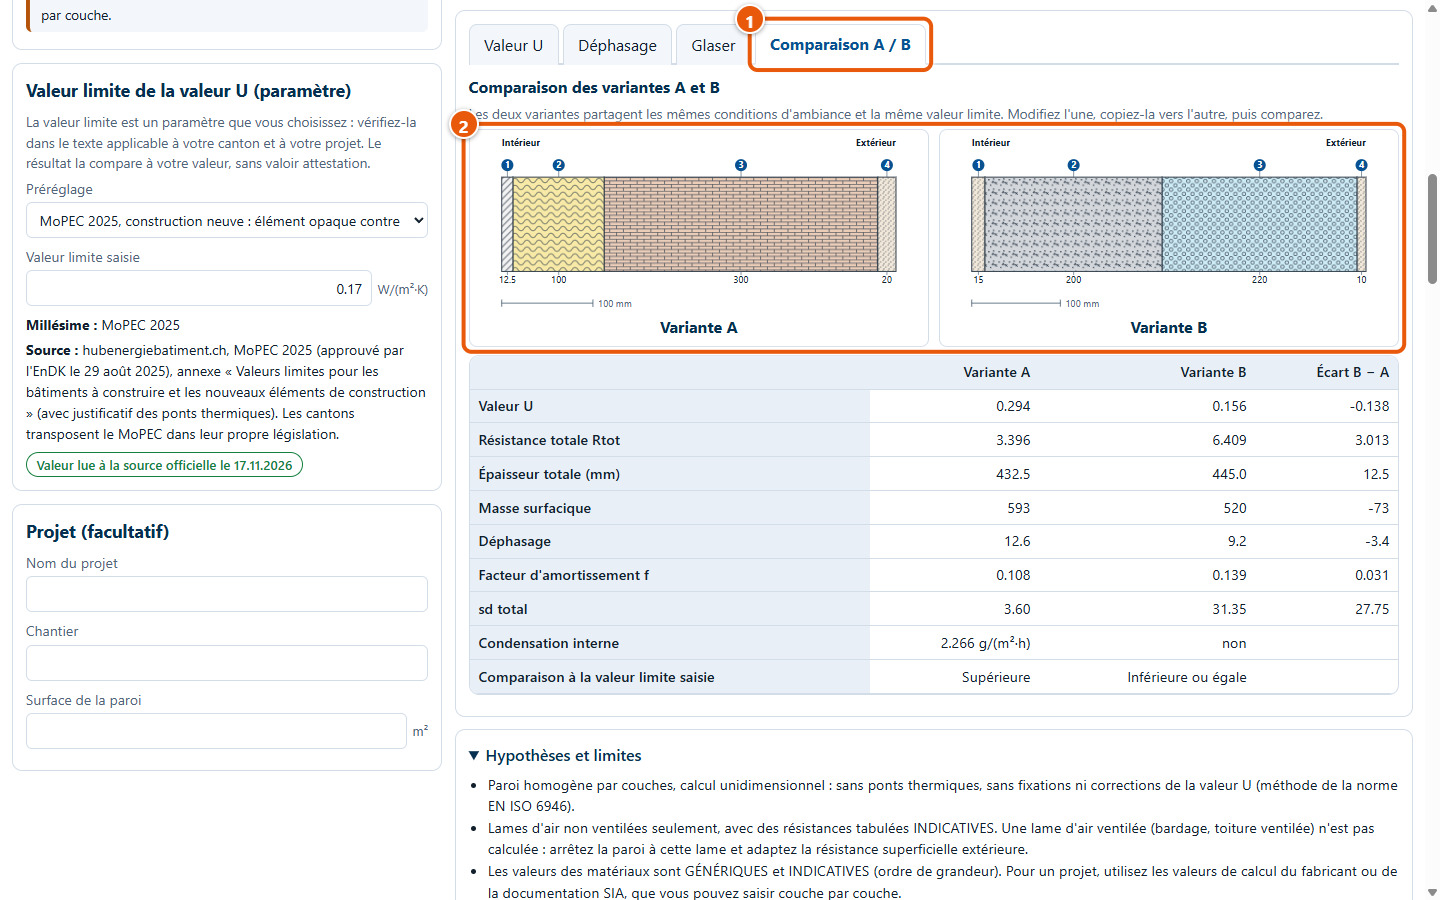
26The differences table
The table compares the U-value, thermal resistance, thickness, surface mass, thermal lag, condensation, and comparison against the limit value, with the difference 'B − A' (1).
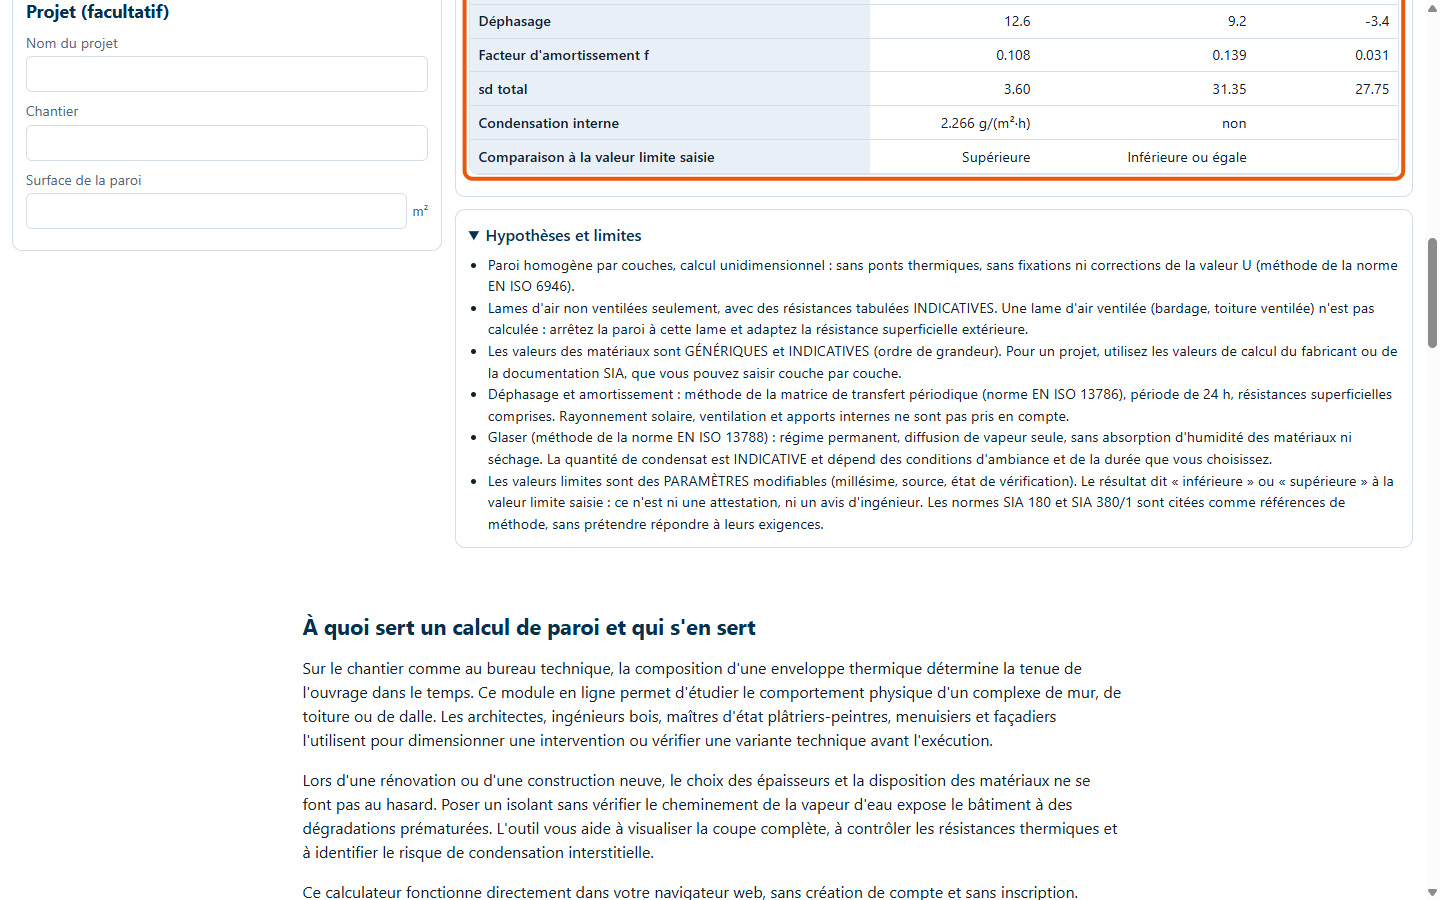
6. Print and export
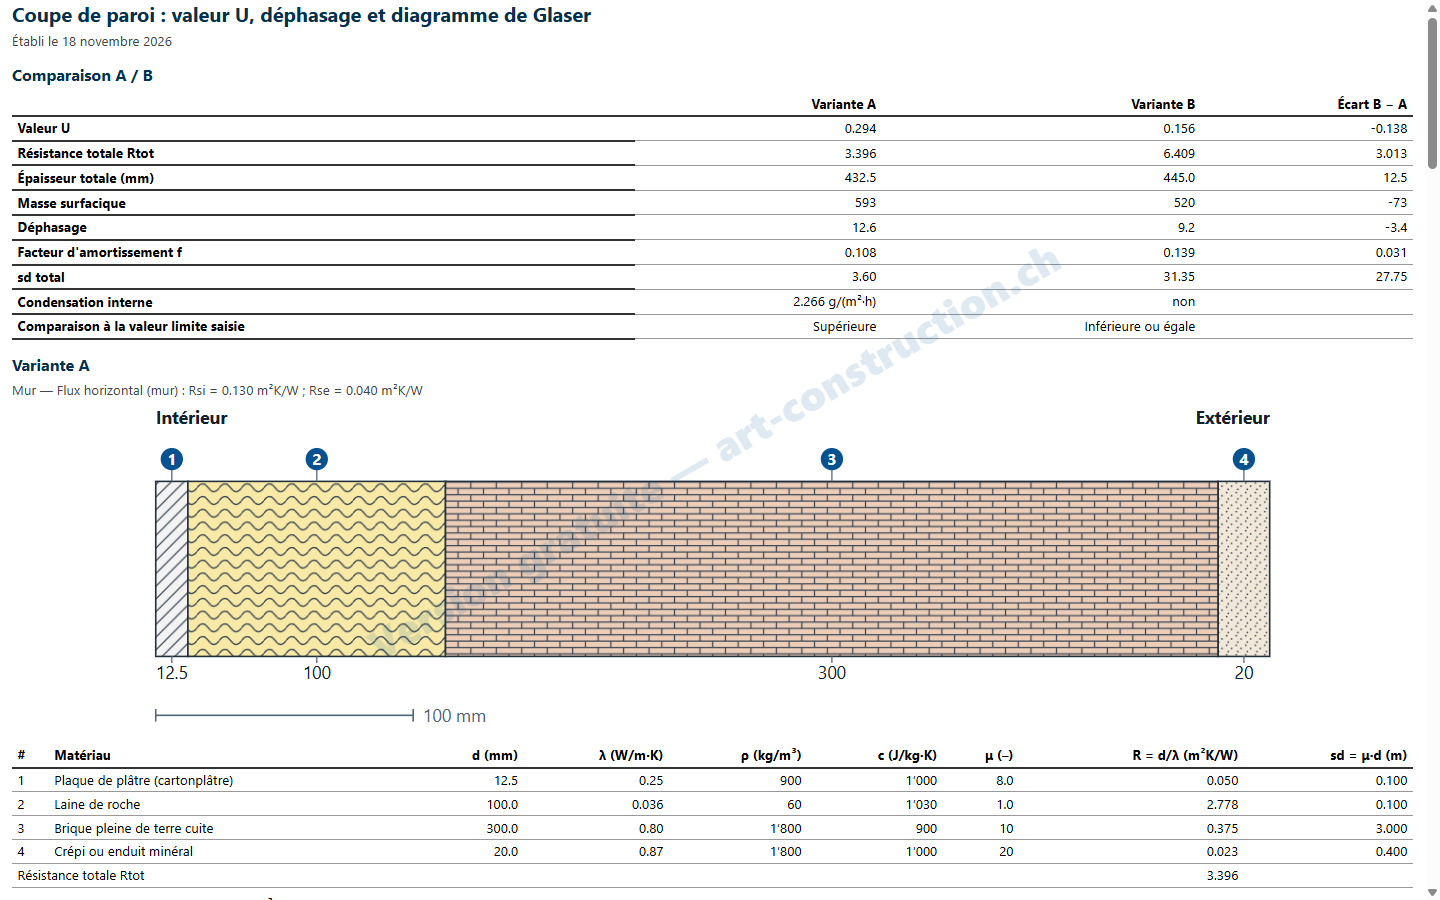
27The results sheet
Imprimer la feuille de résultats prepares a sheet with the variant comparison, the cross-section, the layer table, the results, and the formulas. The free version adds a watermark. The image displays the sheet on screen prior to printing.
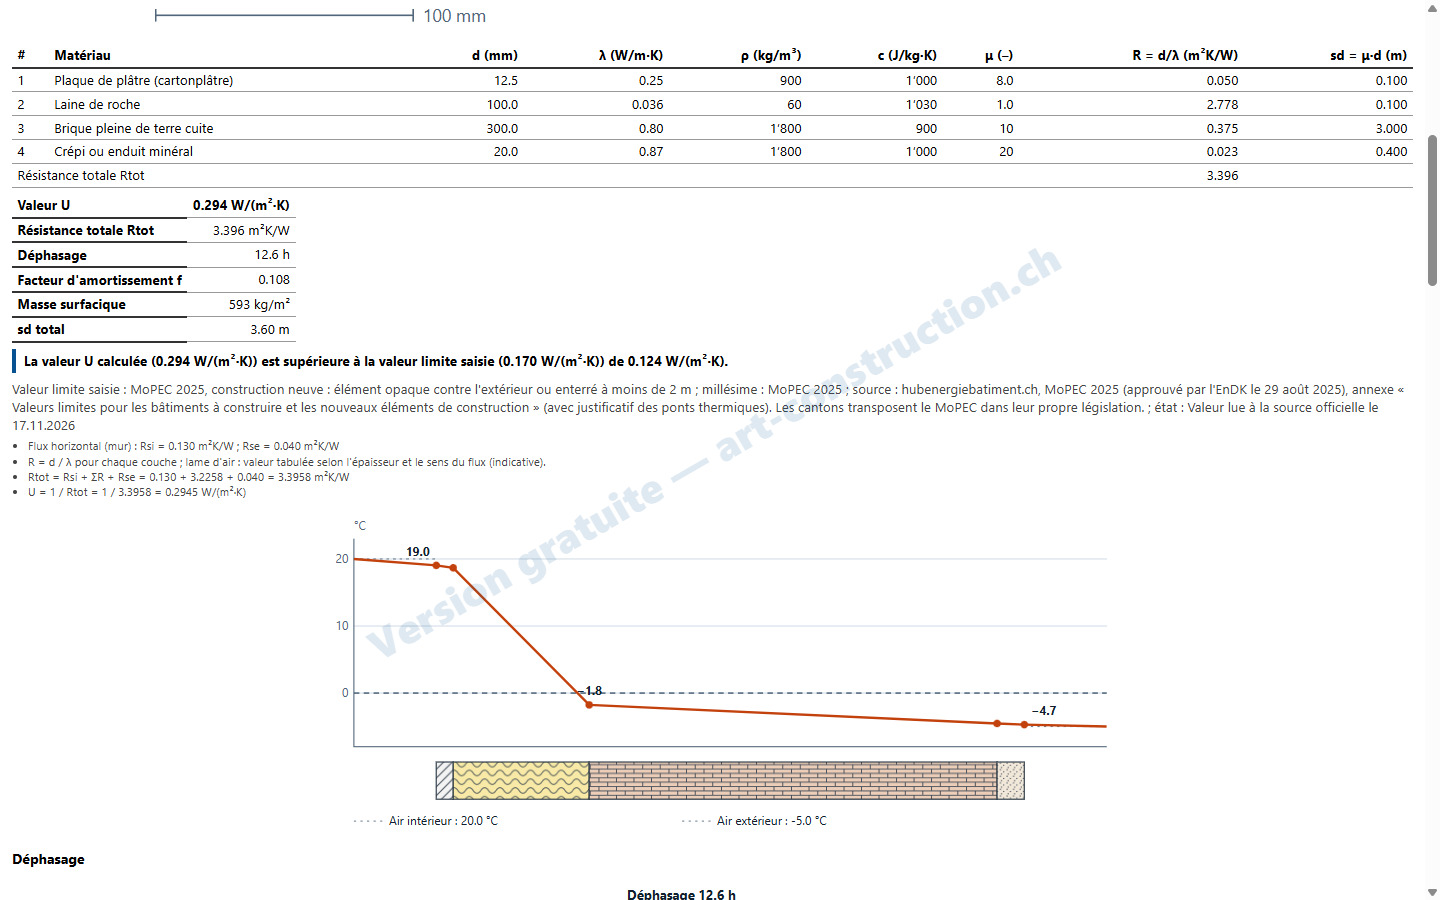
28Continuation of the sheet
The sheet continues with the U-value, thermal lag, the statement comparing against the entered limit value (with its source), formulas, and curves.
29Exporting to CSV
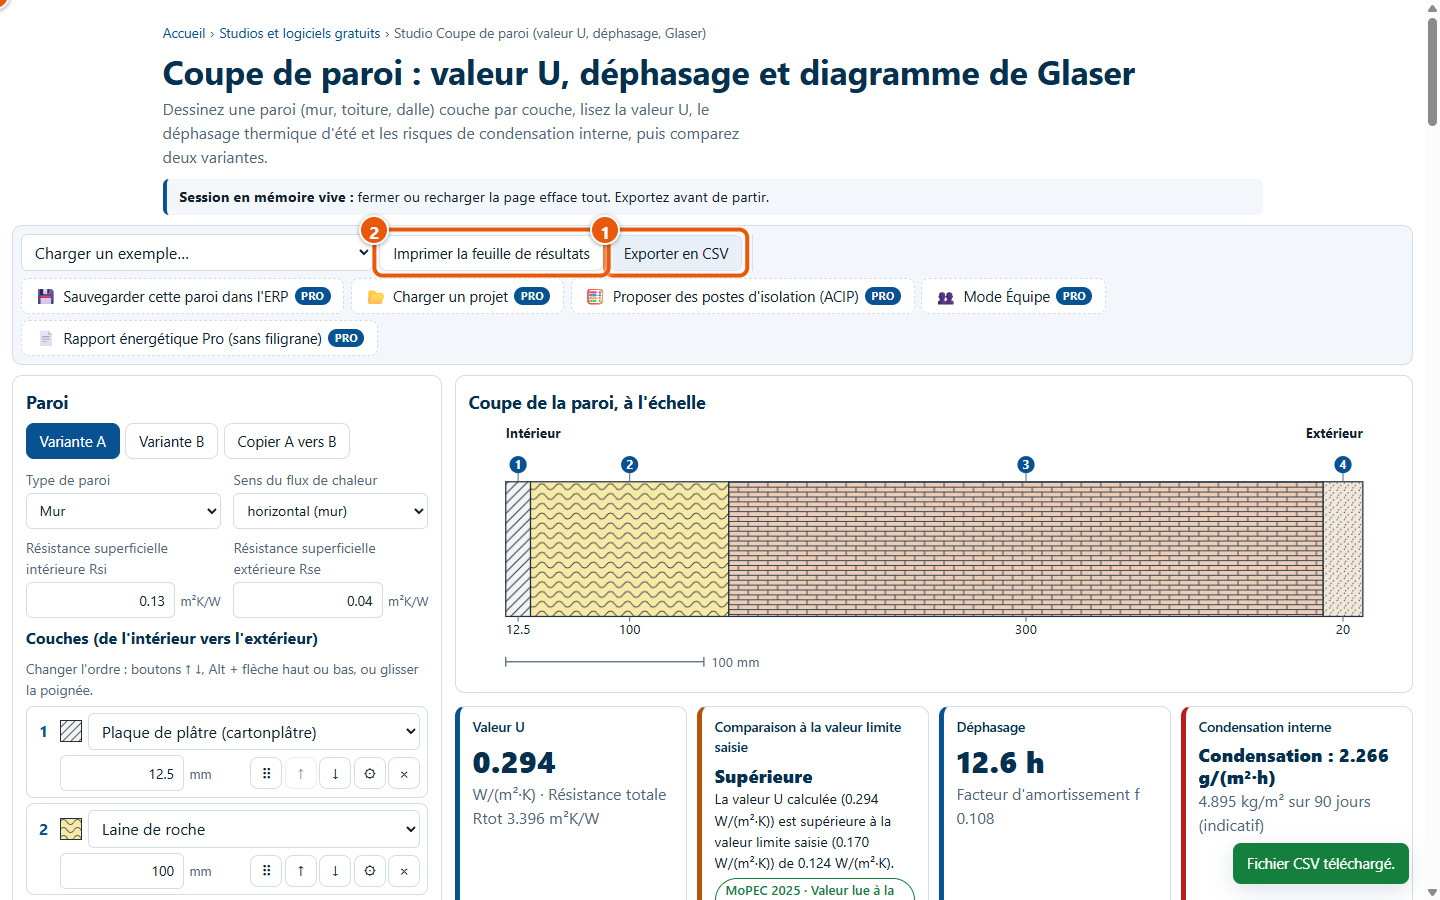
Exporter en CSV (1) downloads a file with layers and results; the free version includes its notice. Imprimer la feuille de résultats (2) prepares the sheet. Nothing is saved: export or print before closing the page. Buttons marked PRO (3) are reserved for the ERP version.
7. What this software does not do
- It compares the U-value to the limit value you select or enter: it never states that a wall is compliant; this is neither a certificate nor an engineering opinion. Check the limit value in the regulations applicable to your canton and project.
- Material values are generic and indicative (orders of magnitude). For a project, enter the manufacturer's design values or SIA documentation values layer by layer.
- Calculations are one-dimensional for a layered homogeneous wall: thermal bridges, fixings, and U-value corrections are not taken into account.
- Only unventilated air cavities are calculated, using indicative tabulated resistances. Ventilated air cavities (cladding, ventilated roofs) are not calculated.
- Thermal lag does not take solar radiation, ventilation, or internal heat gains into account. The Glaser diagram assumes steady-state conditions, without moisture absorption or drying: condensate amounts are indicative and no acceptance threshold is given.
- The free version does not retain any data. Saving, reloading a wall build-up, insulation work items, and watermark-free reports are available solely in the ERP and Tenders versions.
Have a question? Send a support request from this software's page.