Owner Cockpit guide
The Owner Cockpit brings together three tools for running a construction SME: a « Who replaces who » matrix, a 13-week cash flow simulator and a 1-Page Plan. This guide goes from the simplest to the most advanced. On the screenshots, numbered red markers show where to look.
1. Getting started
1Open the Cockpit and read the principle
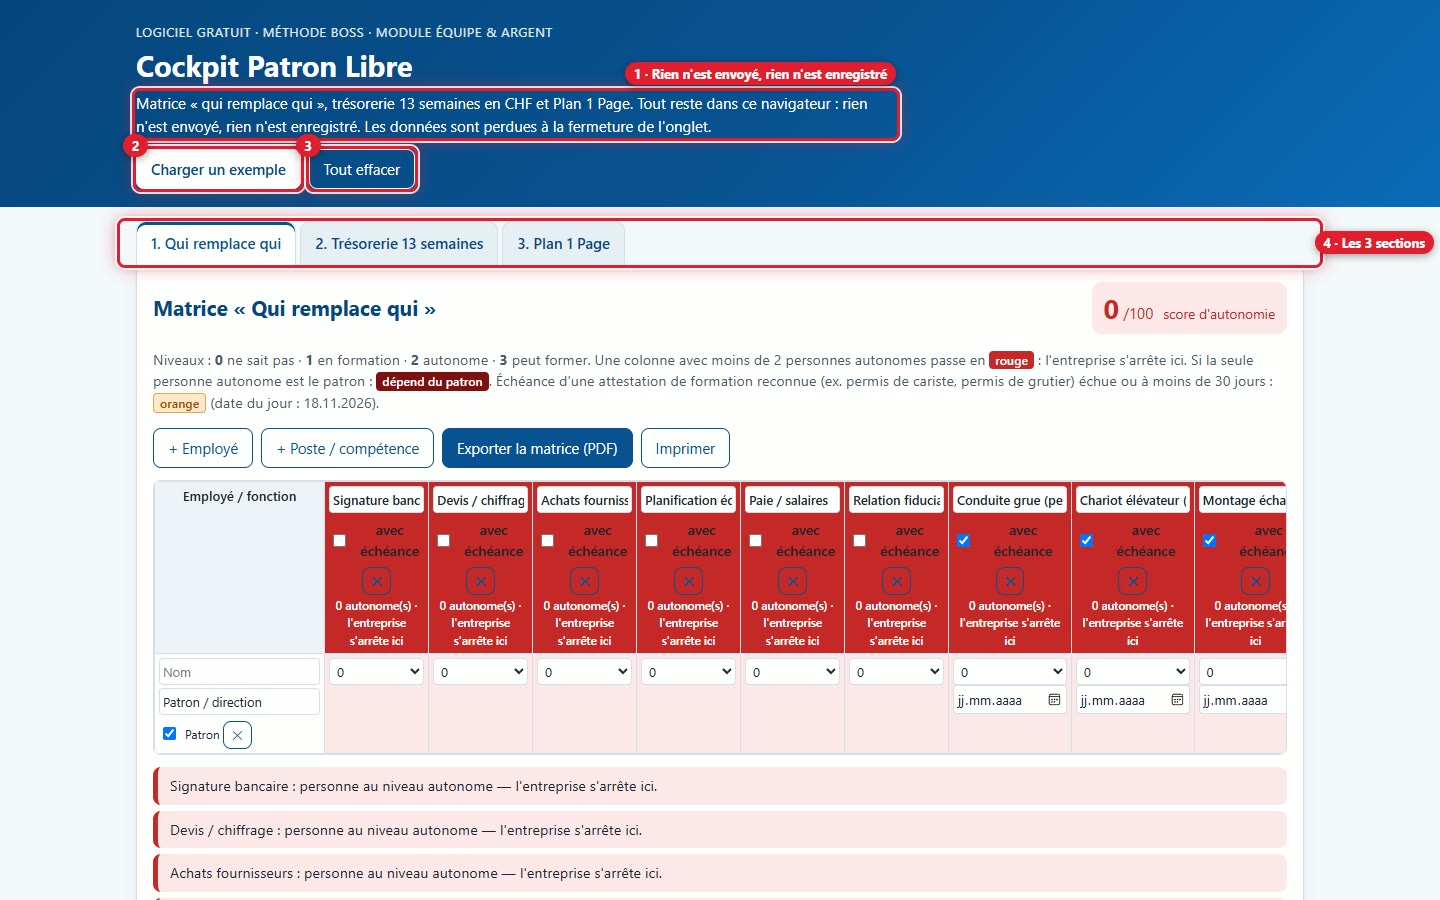
The Owner Cockpit opens in your browser, without registration; the page is titled « Free Boss Cockpit ». The text at the top (1) explains it: everything stays in this browser, nothing is sent and nothing is saved. Three sections (4) follow one another: 1. Who replaces whom, 2. 13-week cash flow and 3. 1-Page plan. Two buttons remain at the top: Load an example (2) and Clear all (3).
2Load the fictional SME example
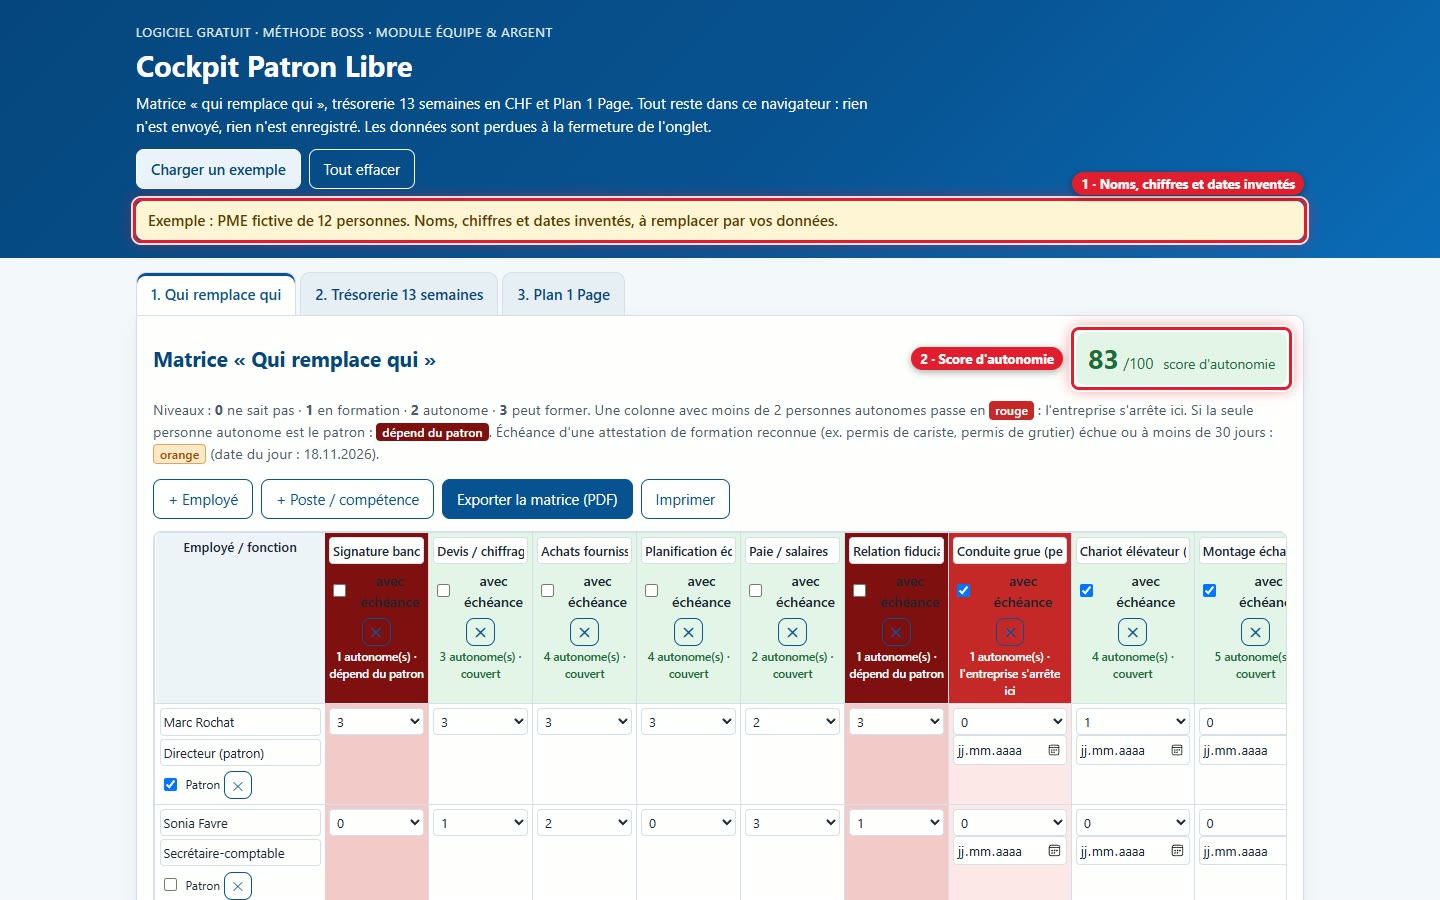
Click on Load an example: the three sections fill up with a fictional construction SME of 12 people. A yellow banner (1) reminds you: names, figures and dates are made up. The autonomy score (2) is displayed. If you have already entered data, the studio first asks to confirm the replacement.
2. Who replaces whom
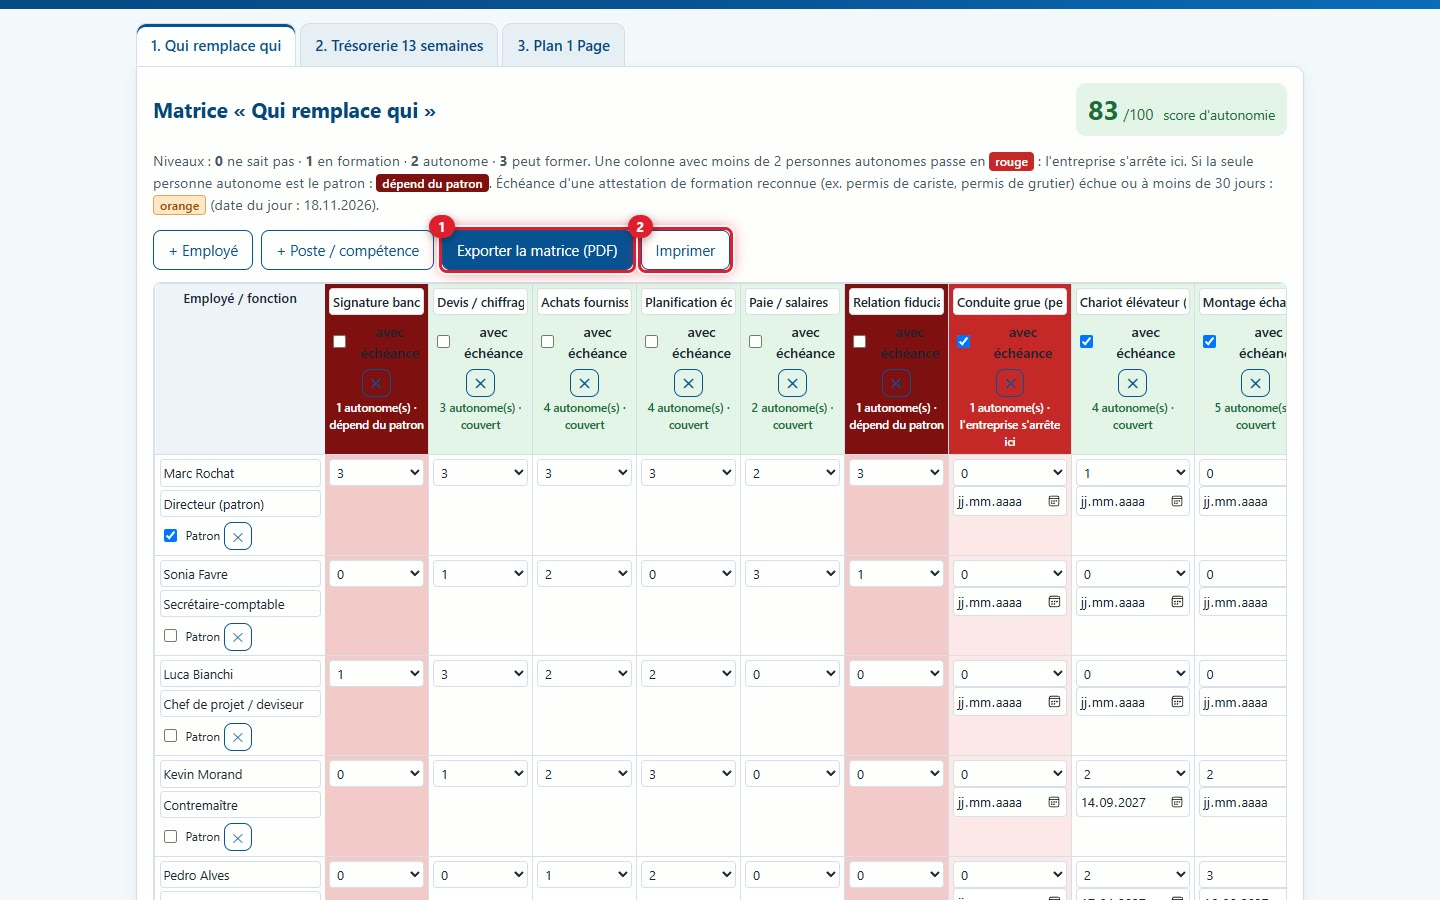
The matrix answers a simple question: if a person is absent, who can replace them? The rows are the people, the columns are the positions or skills. In each box, you note a level from 0 to 3: 0 does not know, 1 in training, 2 autonomous, 3 can train.
3Add a person
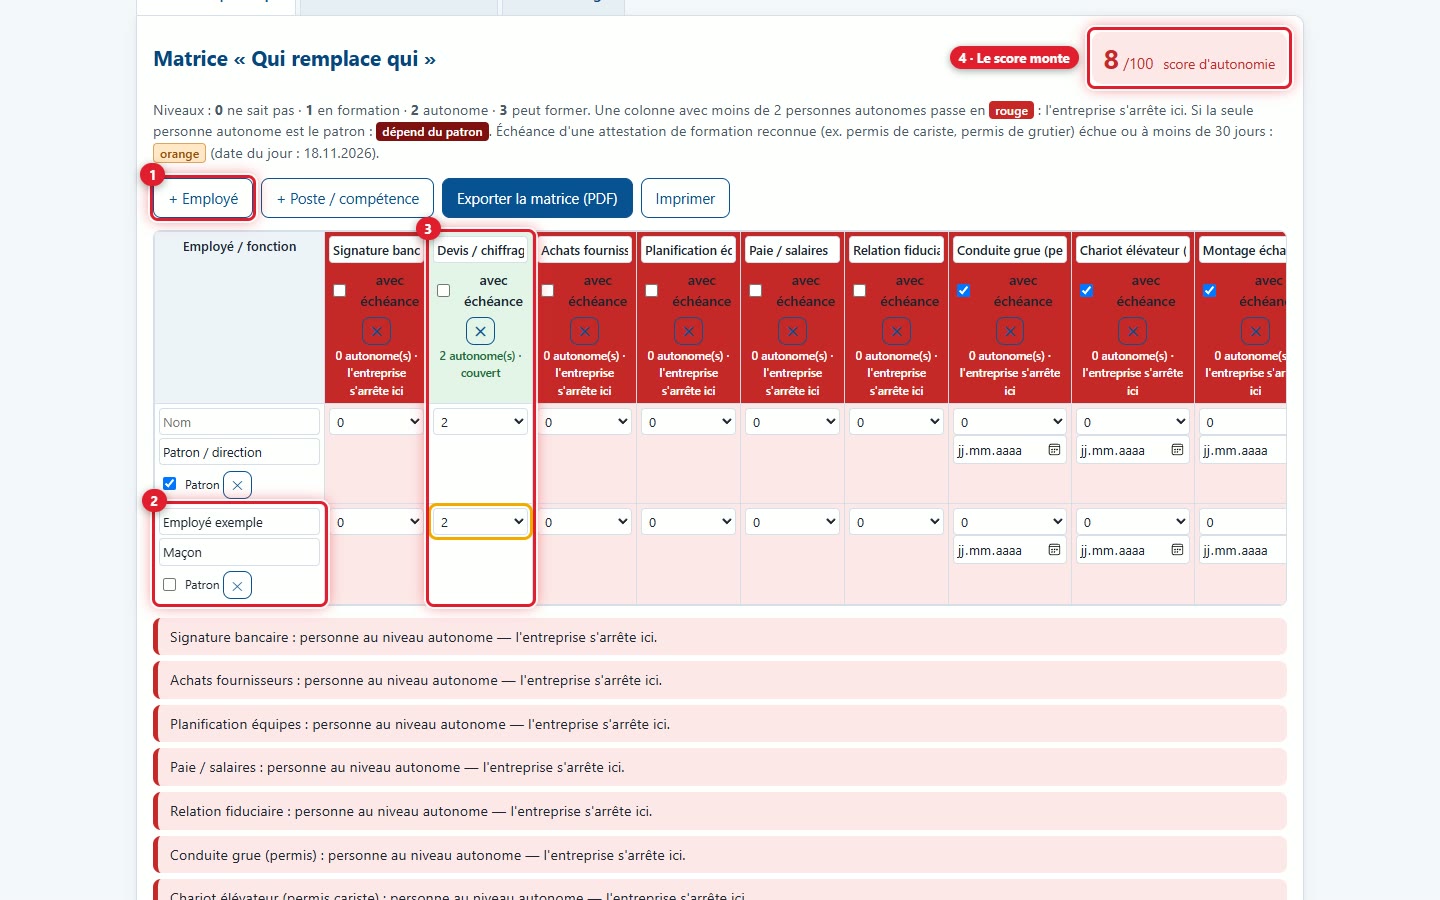
Click on + Employee (1): a row is added and the cursor is placed in its Name field. Write the name and role, then tick Boss if the person is the boss or management (2). The ✕ button on the row deletes the person. Then choose a level in each box. As soon as two people have level 2 or more in a column, the column turns green (3) and the score goes up (4). The video shows the action, starting from an empty cockpit.
4Add a position or skill
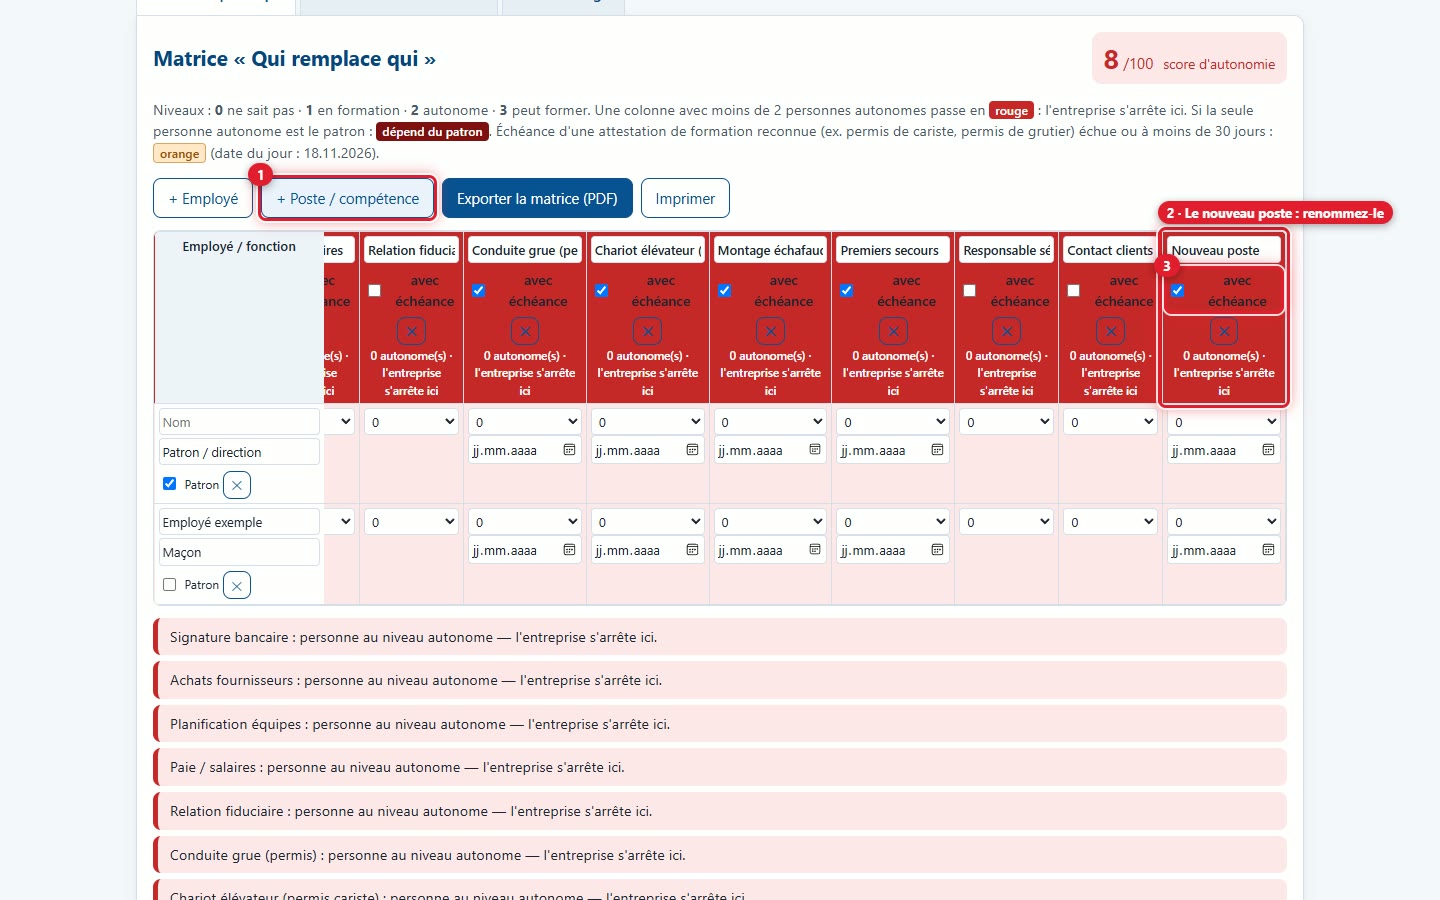
Click on + Position / skill (1): a New item column is added on the right (2). Change its name in the top field. Check with deadline (3) when the item requires a certificate that expires, for example a forklift licence: a date is then added in each cell of the column. The ✕ button of the column deletes it.
- The studio offers 12 items to start with: bank signature authorization, quote / costing, supplier purchases, team scheduling, payroll / wages, fiduciary relationship, crane operation, forklift, scaffolding erection, first aid, MSST safety officer and key client contacts.
- The four items that require a licence or certificate (crane, forklift truck, scaffolding, first aid) are already set to with deadline.
5Reading the colours and the score
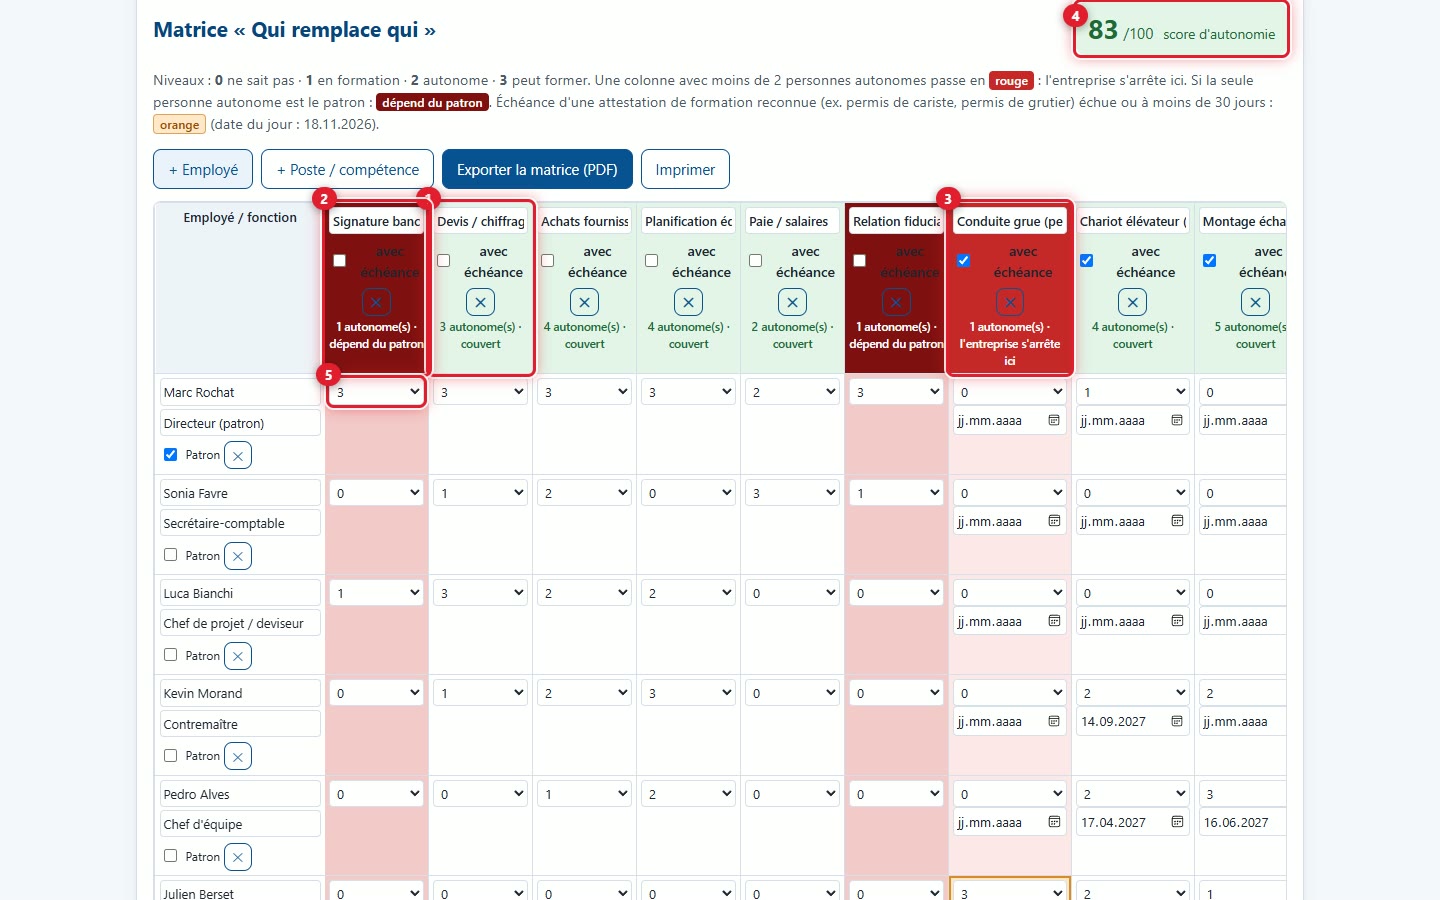
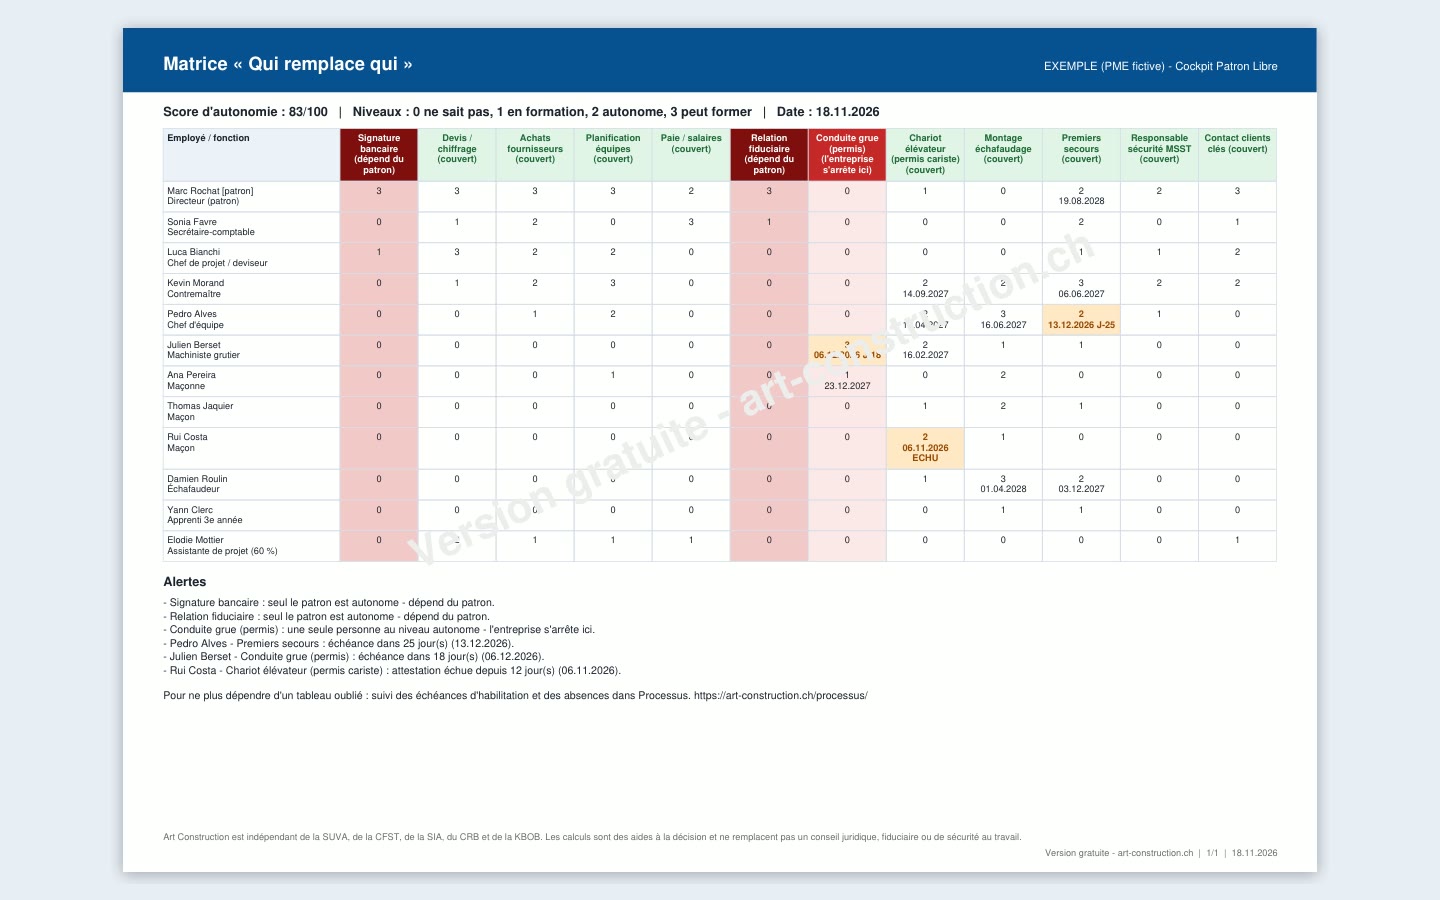
Each column has a colour and a status line at the bottom of its header. (1) Green: at least two autonomous people (level 2 or 3), the position is covered. (2) Dark red: only one person is autonomous and it is the boss, the position depends on the boss. (3) Red: no one is autonomous, or one person only who is not the boss: « the company stops here ». (4) The autonomy score ranges from 0 to 100: green from 80 upwards, orange from 50 to 79, red below. (5) Each box is set with a level from 0 to 3.
6Reading the list of alerts
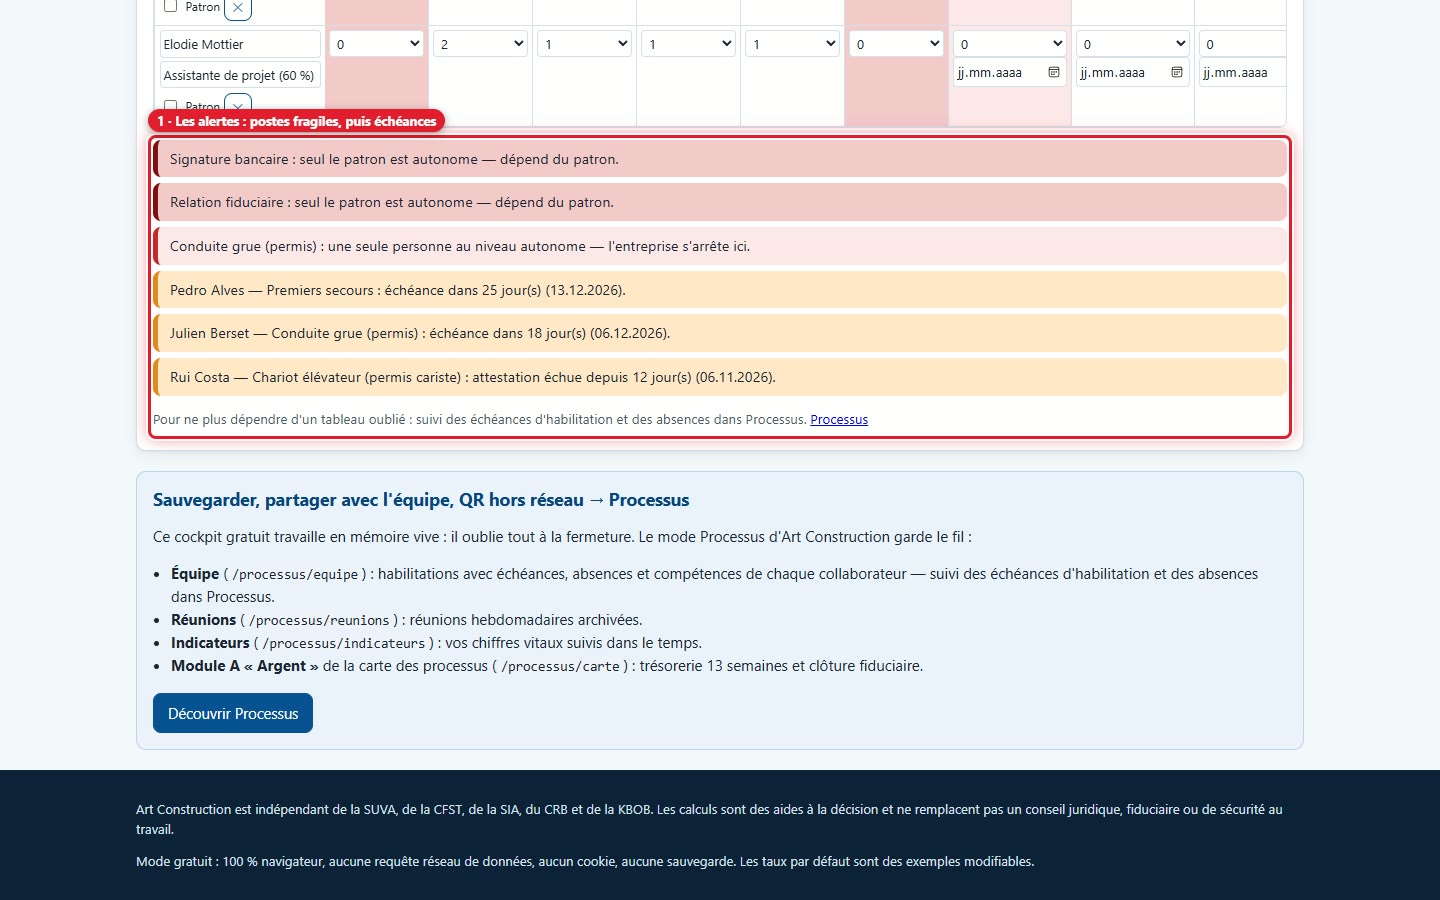
Below the matrix, a list states clearly what is wrong: first the fragile positions, column after column, then the licence deadlines. If there is nothing to report, a message says so. Below the list, a link leads back to Processus.
7Tracking an approaching licence deadline
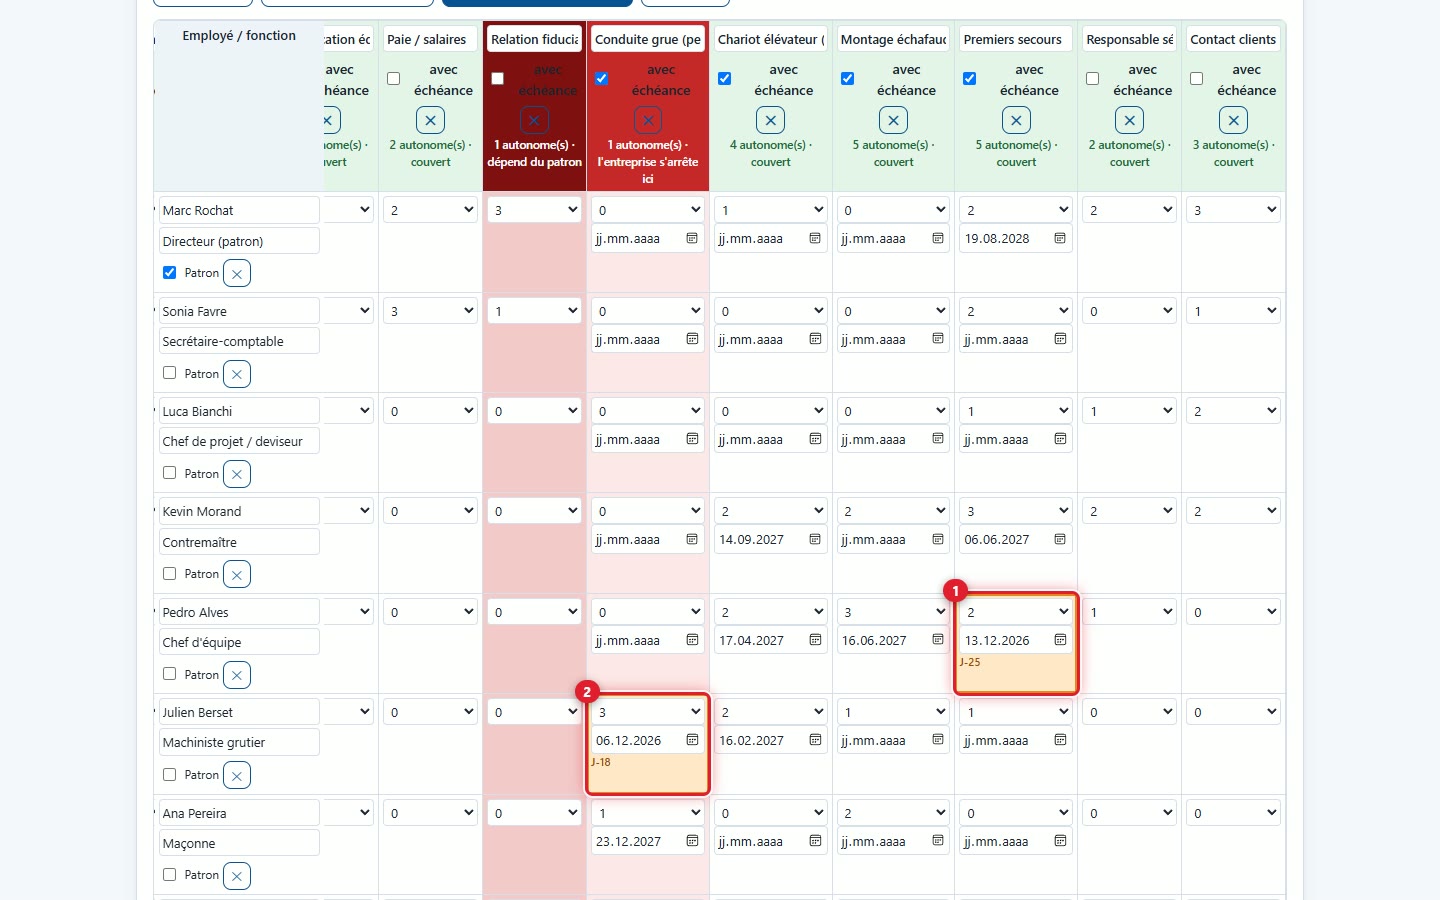
In a column with deadline, enter the expiry date for each person. Within 30 days of this date, the box turns orange and shows the remaining days, for example « J-25 » (1) or « J-18 » (2). The alert compares the entered date with your computer's current date.
8Spotting an overdue deadline
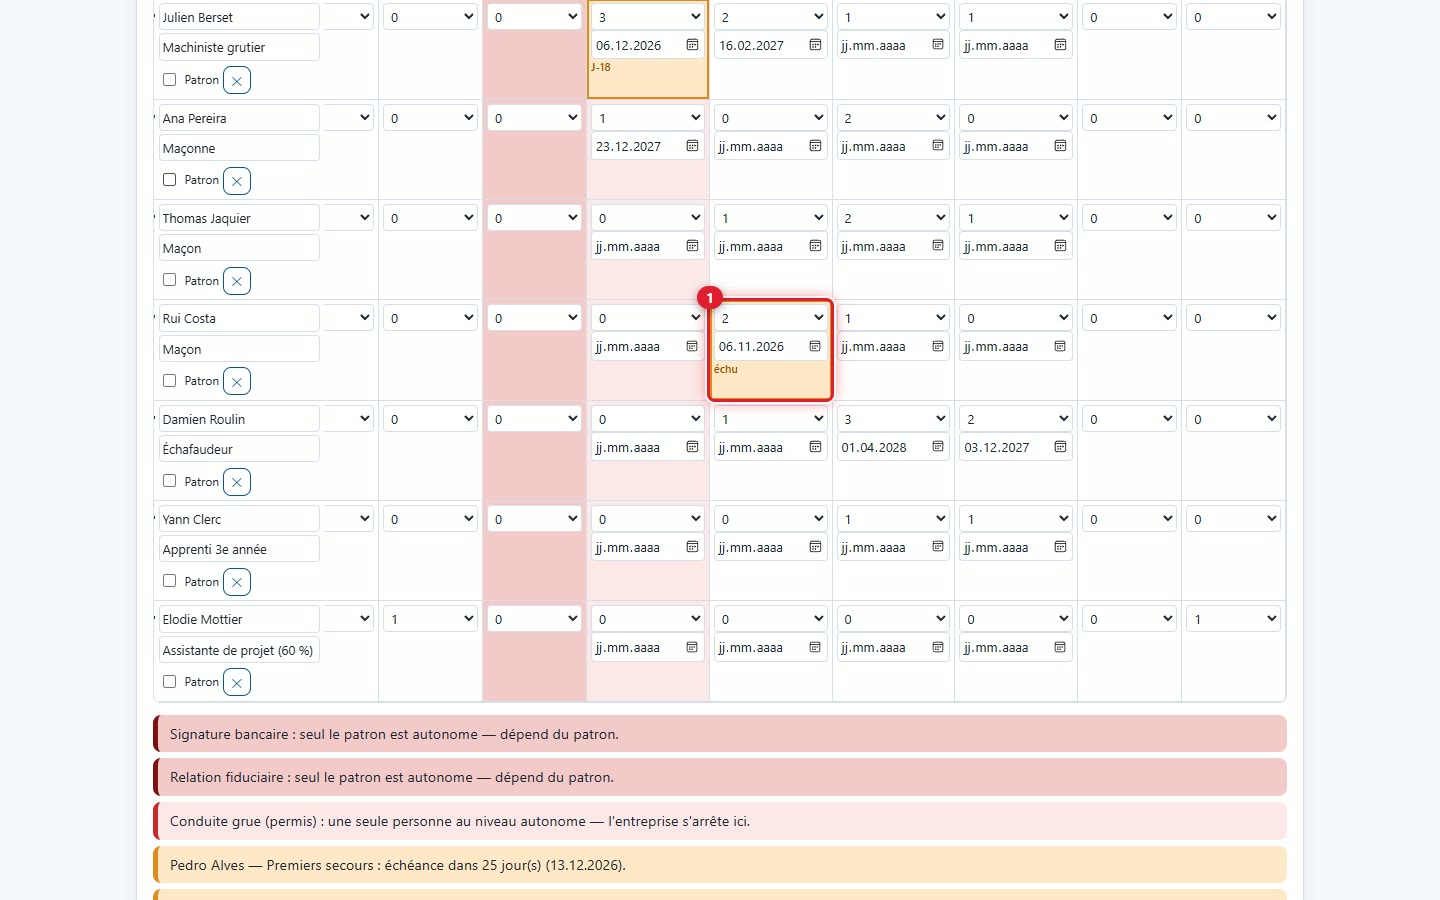
When the date has passed, the cell remains orange and displays "overdue" (1). The alerts list then shows how many days overdue the certificate is.
9Exporting the matrix or printing it
Export matrix (1) downloads an A4 PDF in landscape format. Print (2) opens your browser's print window.
10The matrix PDF
The PDF reproduces the matrix with its colours, the score, the current date and the list of alerts. Each page bears the watermark « Free version - art-construction.ch ». The example file below was produced with the dummy SME.
3. 13-week cash flow
The simulator tracks your bank account for 13 weeks, starting from the date you choose. Payments leave the account and cause the balance to vary. Provisions (VAT due but not yet paid, accumulated 13th salary) do not leave the account yet: they are shown separately. Amounts are in CHF and rounded to 0.05 CHF.
11Setting the start, salaries and the 13th salary
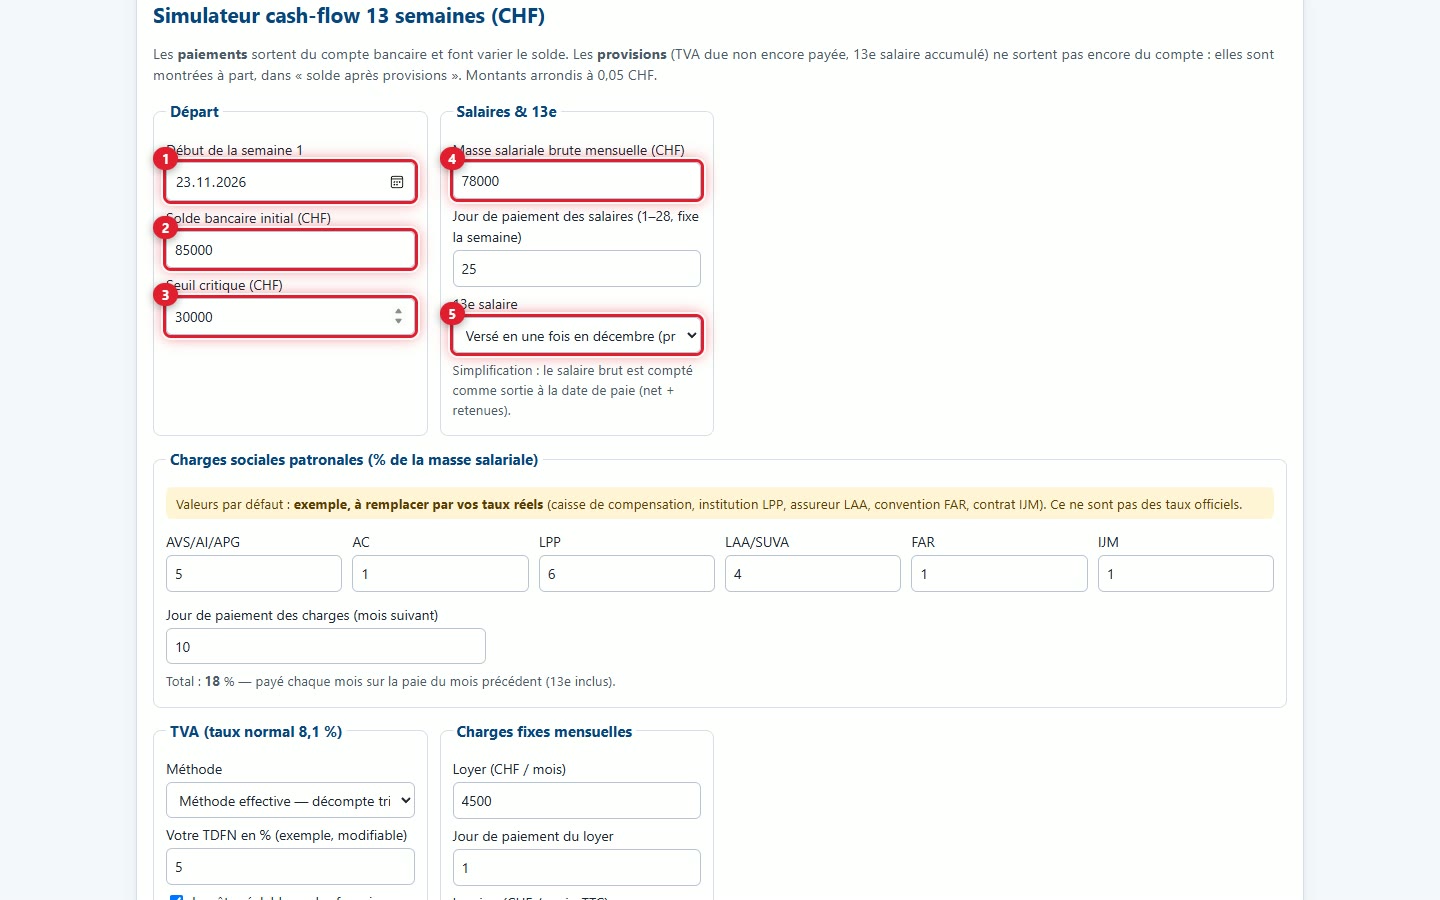
In the first block: (1) Start of week 1 (the system suggests the next Monday), (2) Initial bank balance (CHF) and (3) Critical threshold (CHF), the balance below which you want to be alerted. In Salaries & 13th salary: (4) the gross monthly payroll and its payment day (from 1 to 28), then (5) the 13th salary mode: paid in full in December (accrued 1/12 per month) or every month by 1/12 with the salary.
12Entering social security contributions
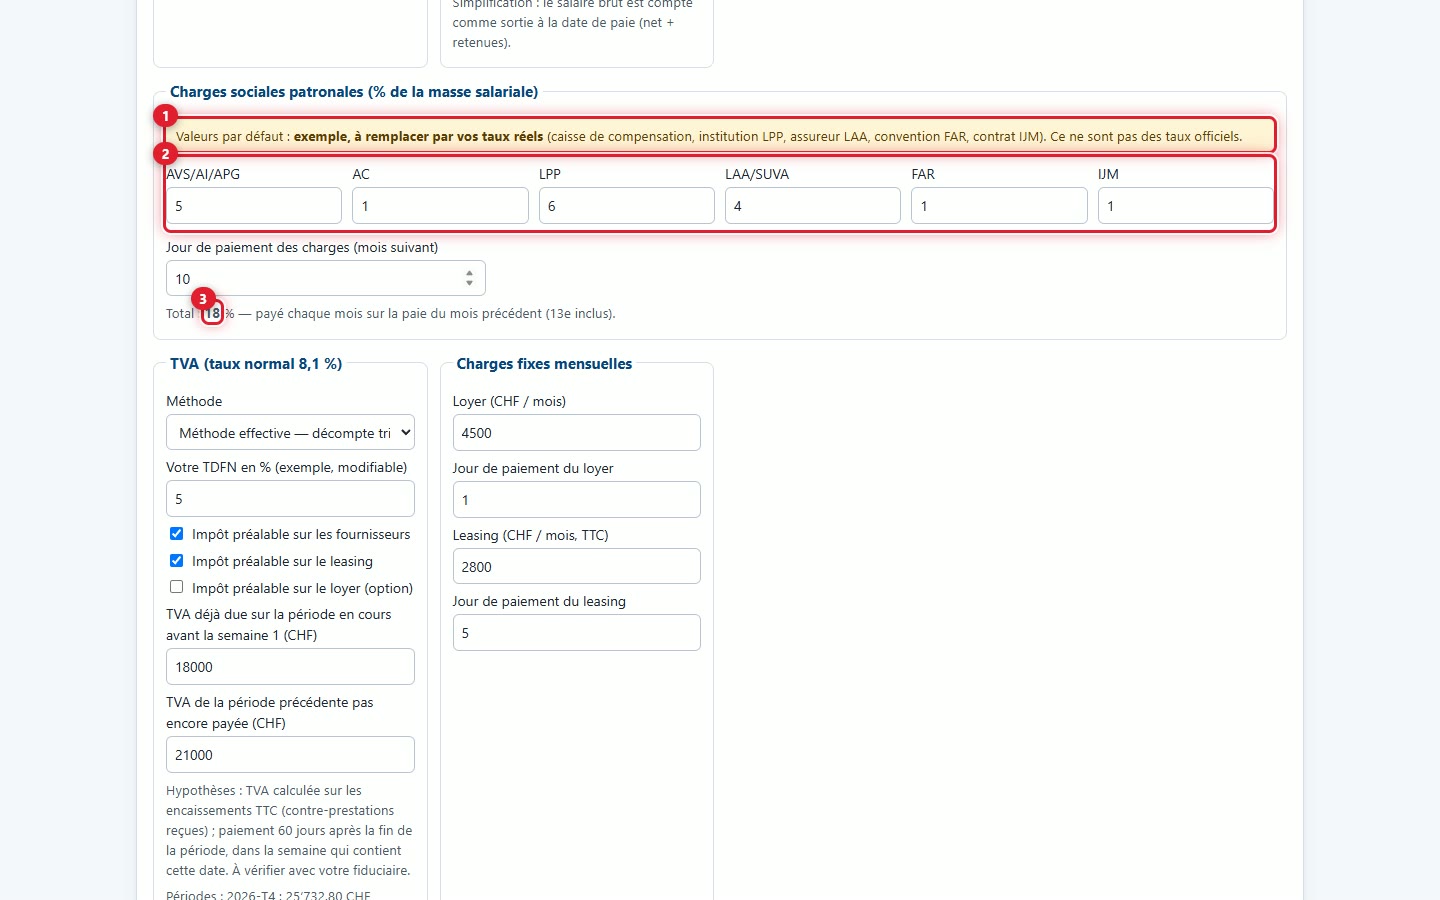
(1) The starting rates are examples, not official rates: replace them with your actual rates (compensation fund, LPP institution, LAA insurer, FAR collective agreement, IJM contract). (2) One box per insurance: AVS/AI/APG, AC, LPP, LAA/SUVA, FAR and IJM. (3) The total is displayed. It applies to the previous month's pay, 13th salary included, and is paid on the Charges payment day that you choose.
13Set VAT, rent and leasing
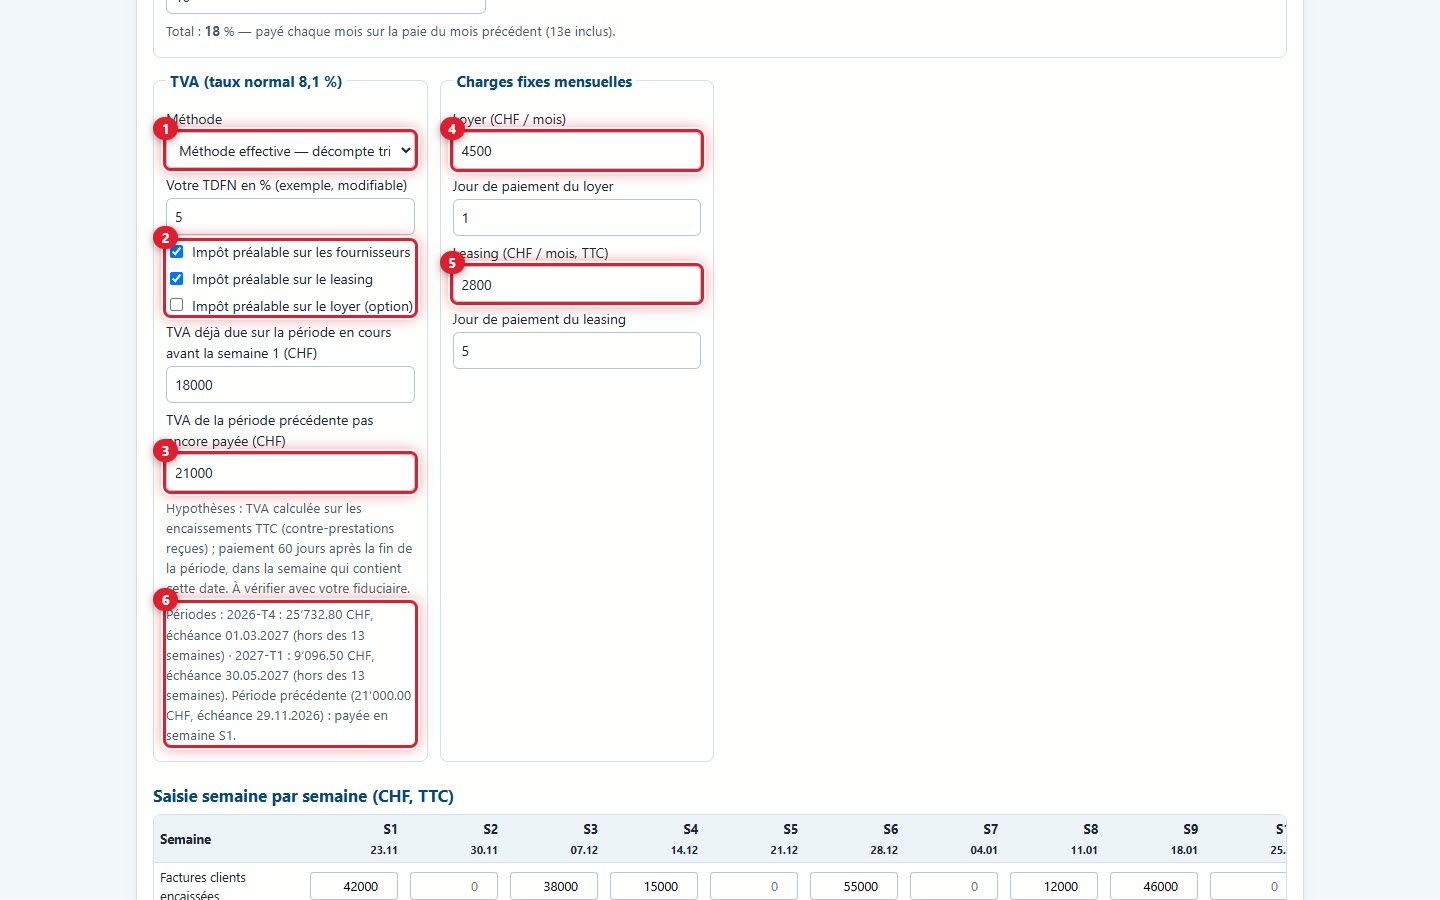
(1) Method: Effective method — quarterly settlement or NFDR (net flat-rate tax rate) — semi-annual return. (2) With the effective method, check the input taxes to deduct: suppliers, leasing, and optional rent. (3) Enter the VAT already due before week 1 and that of the previous period not yet paid. (4) and (5) Enter the month's rent and leasing, with their payment day. (6) The text at the bottom gives, for each period, the VAT amount, the deadline and the payment week.
14Choose the NFDR method
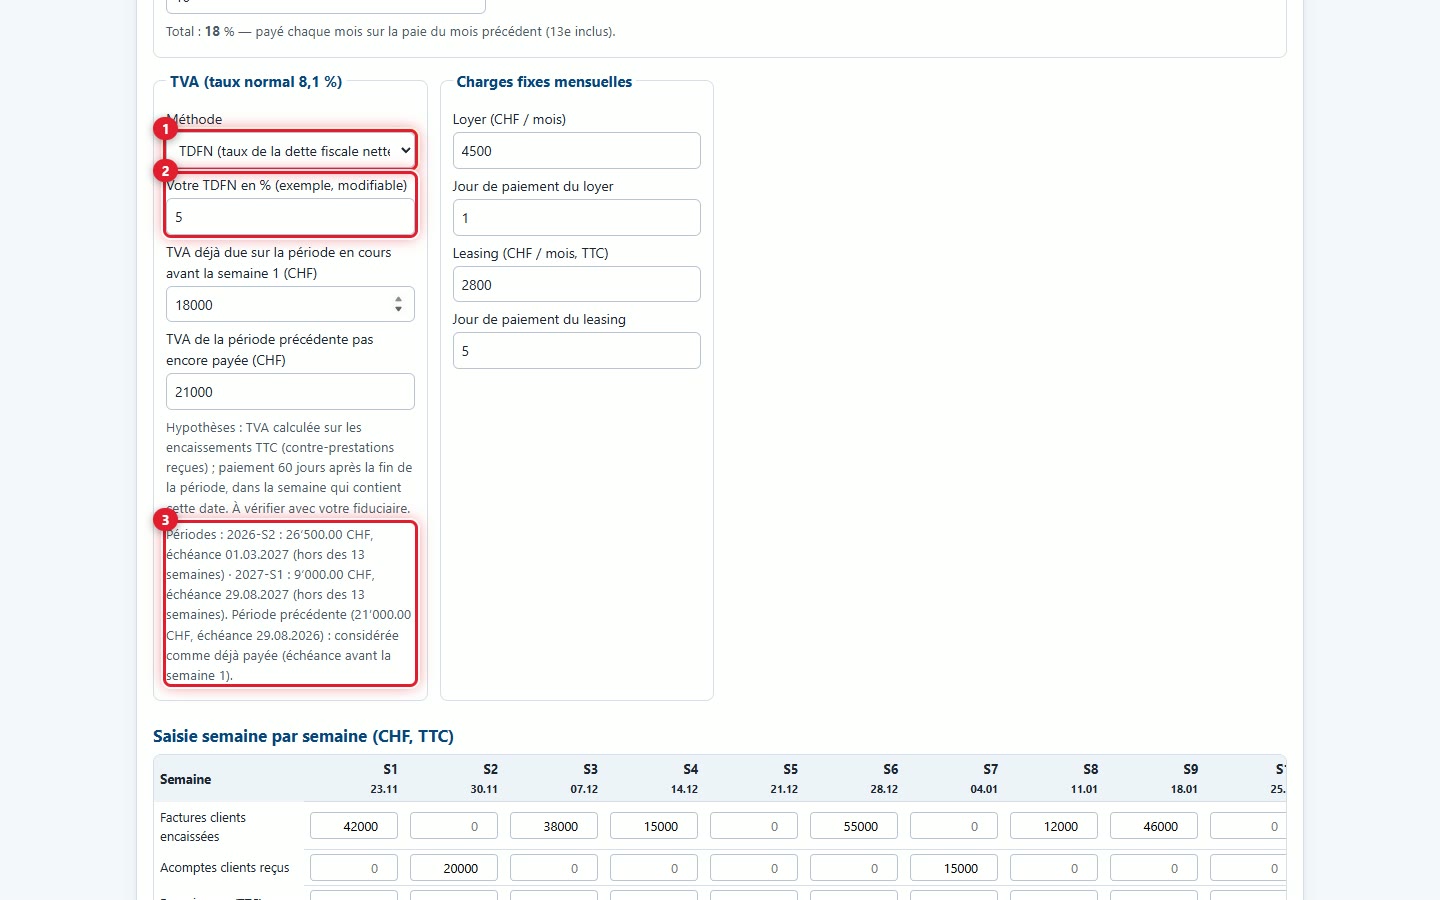
With the NFDR method (1), the Your TDFN in % (example, modifiable) field appears (2) with an example value to replace, and the input tax boxes disappear. The settlement becomes semi-annual: the text at the bottom shows it (3).
15Enter amounts week by week
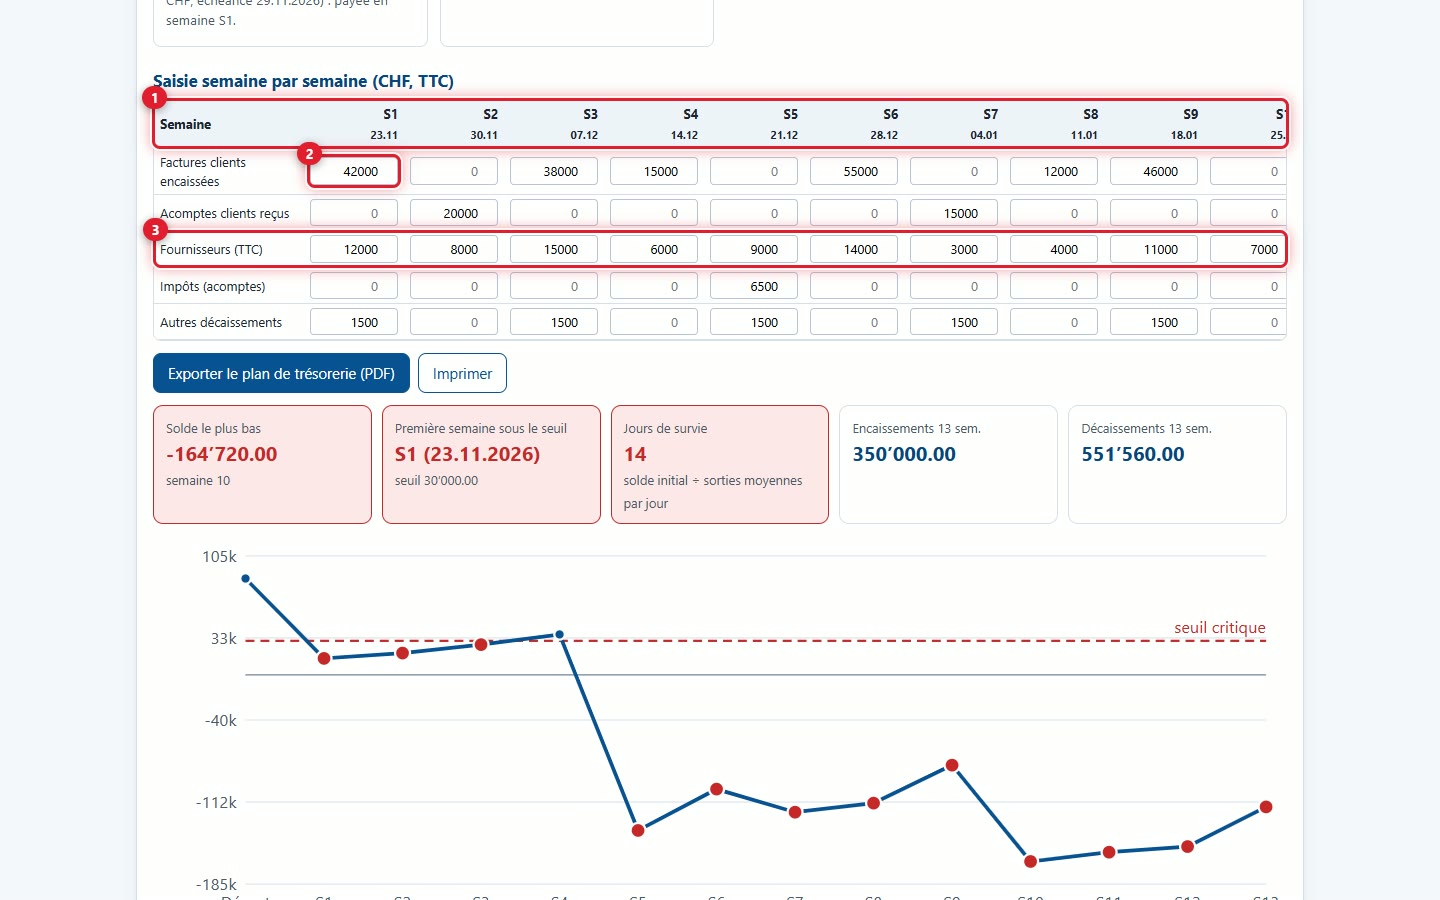
The Week-by-week entry (CHF, incl. VAT) table has one column per week, from S1 to S13, with the start date of the week (1). Five rows: Client invoices collected (2), Client advance payments received, Suppliers (incl. VAT) (3), Taxes (advance payments) and Other disbursements. The results update with each figure entered. The table scrolls to the right to view the last weeks. The video shows three amounts entered and the indicator cards changing.
16Read the five indicators
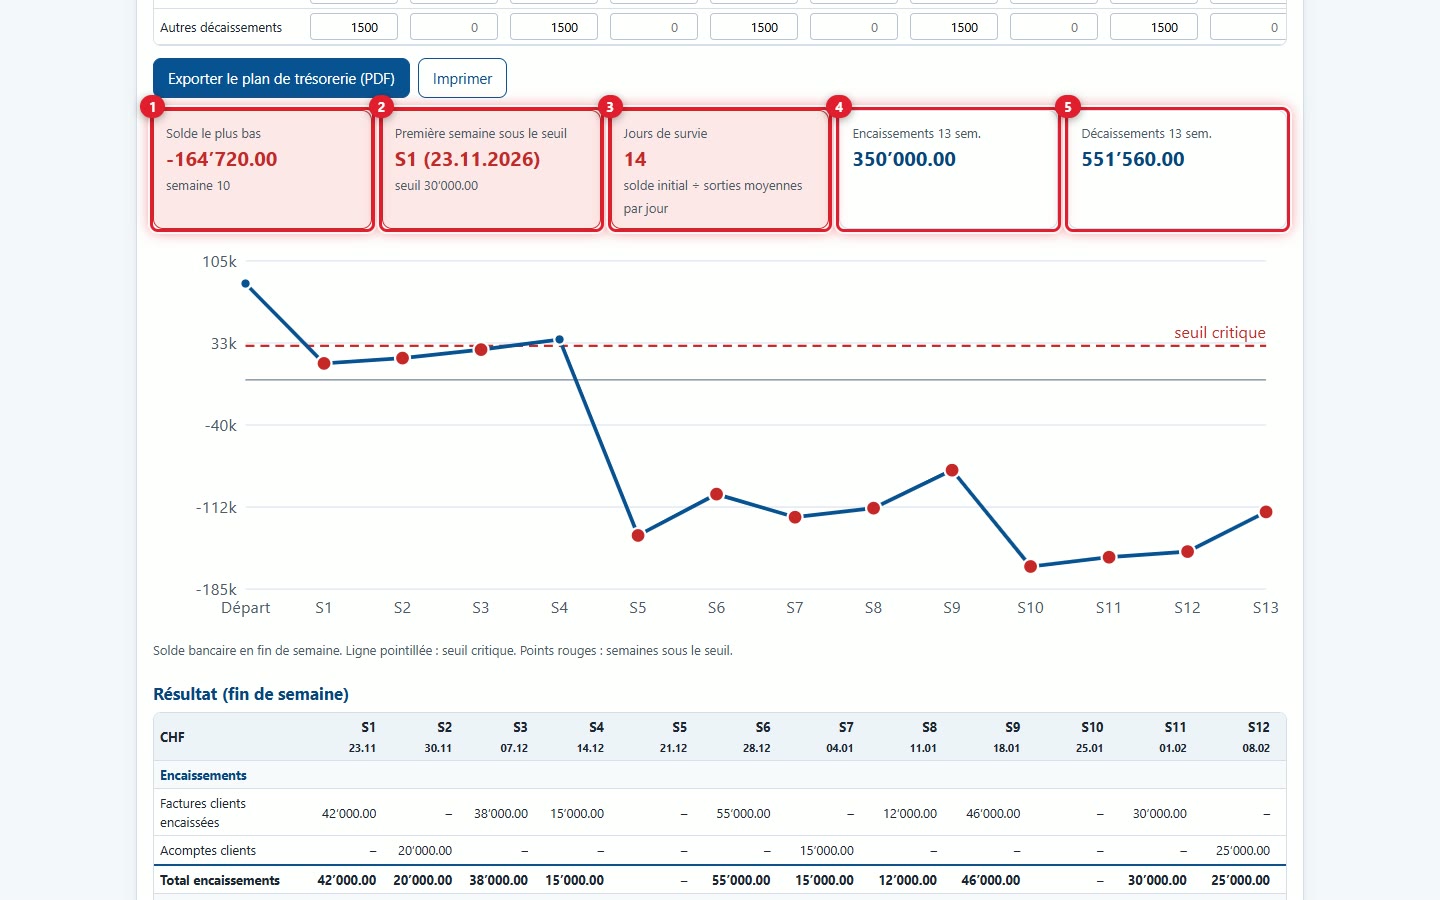
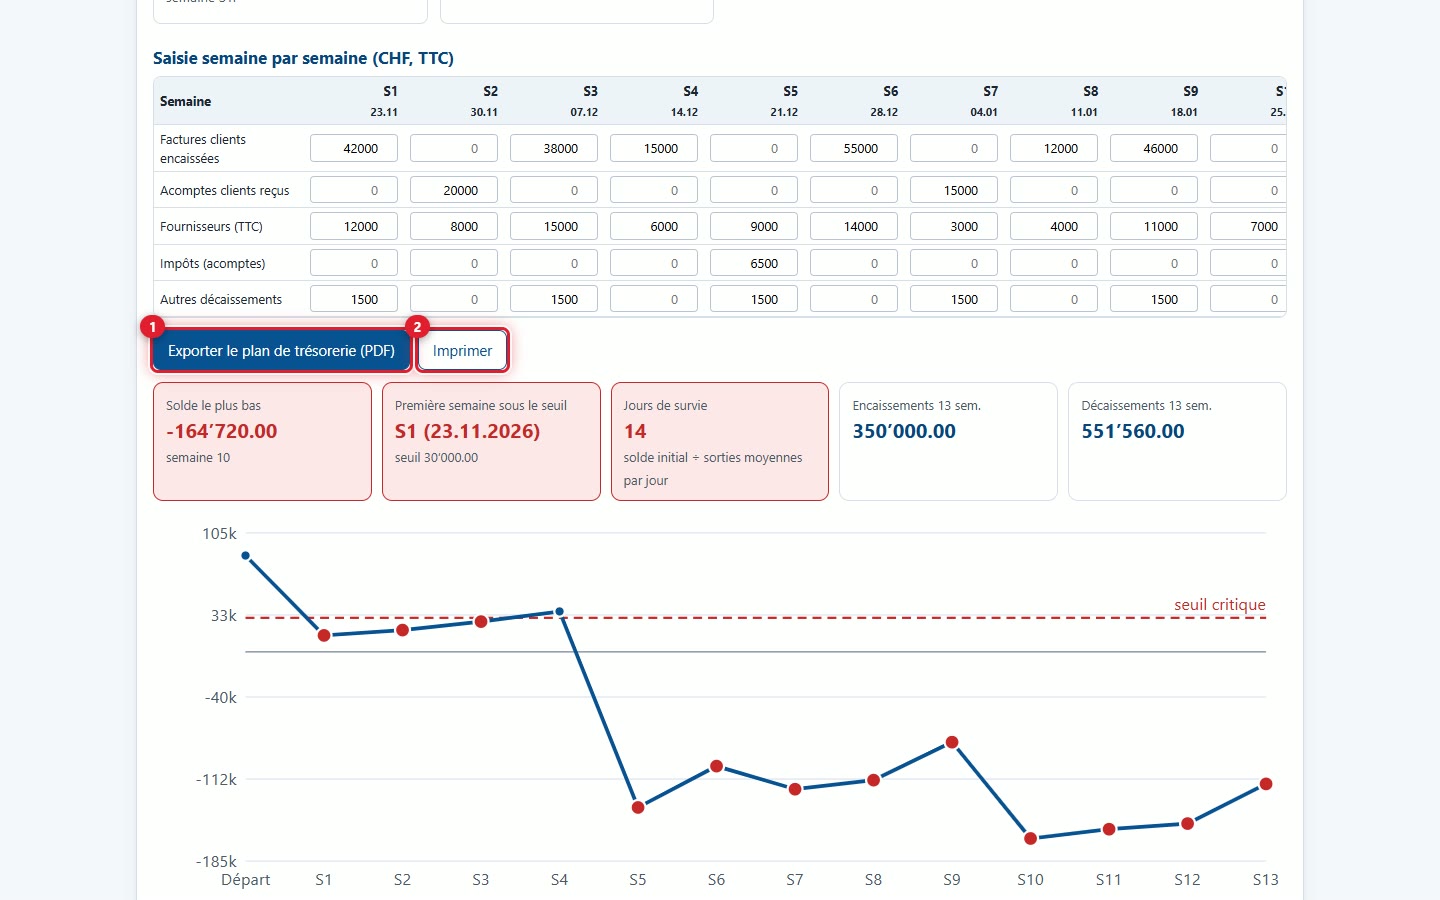
(1) Lowest balance, with the week it occurs. (2) First week below the threshold. (3) Survival days: the opening balance divided by average daily outflows. (4) Receipts 13 wk. and (5) 13-week cash outflows: totals over 13 weeks. A card turns red when the signal is bad: lowest balance below the threshold, a week below the threshold, or fewer than 91 survival days.
17Read the chart
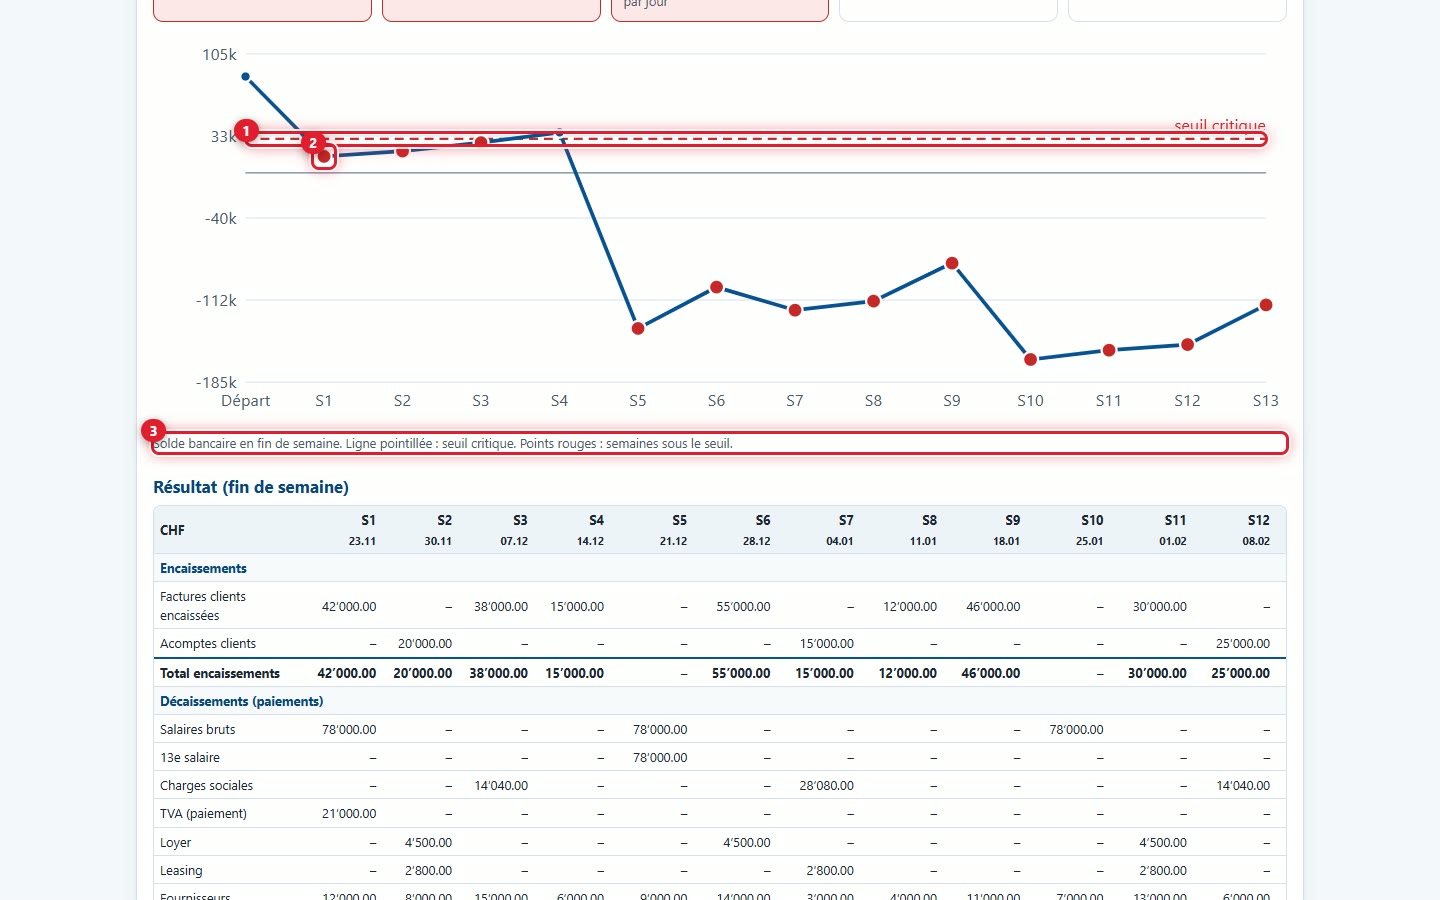
The blue curve shows the bank balance at the end of each week, from the start. (1) The dashed red line is the critical threshold. (2) The red points are the weeks below the threshold. (3) The legend recalls these markers. Hover over a point to read the amount.
18Read the table: payments
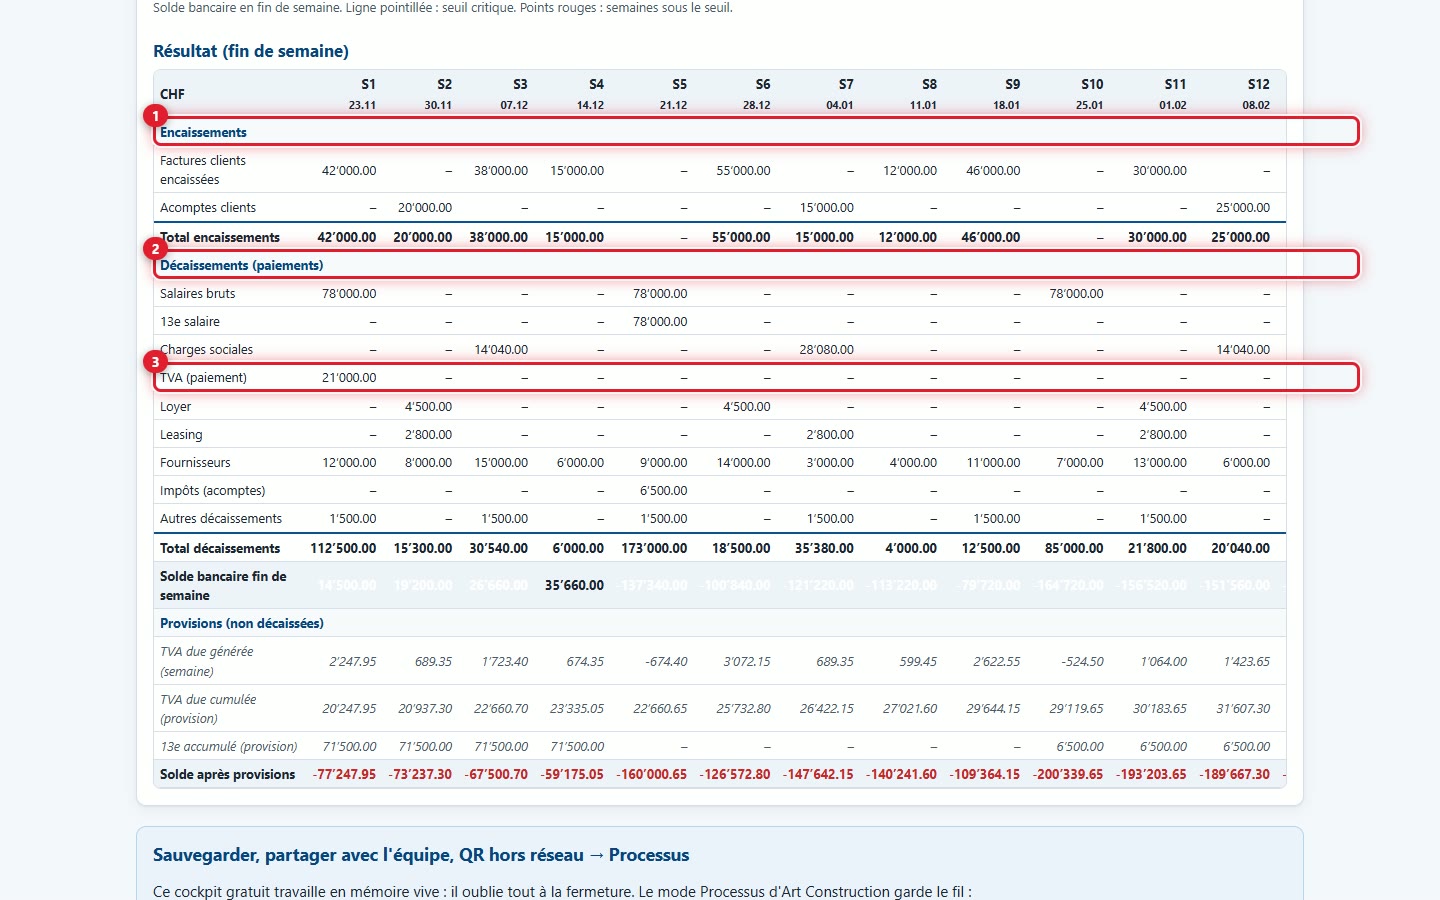
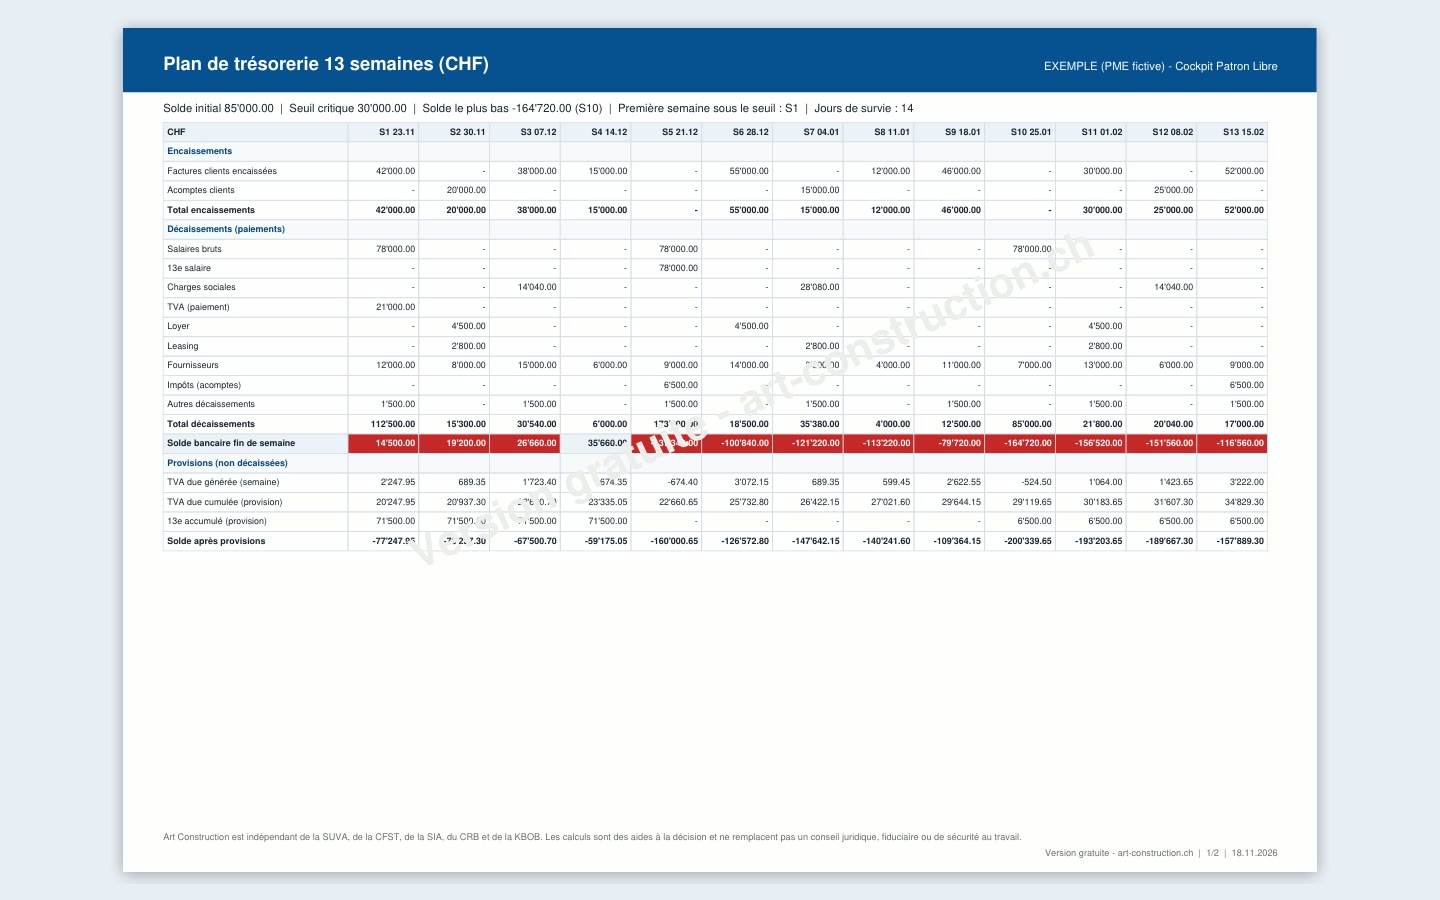
The Result table covers the 13 weeks. (1) Cash inflows: what comes in. (2) Disbursements: what goes out, namely gross salaries, the 13th salary, social security contributions, VAT, rent, leasing, suppliers, taxes and other disbursements. (3) The VAT row is only filled in the week VAT is paid. Lower down, the End-of-week bank balance row gives the account balance.
19Read the table: provisions
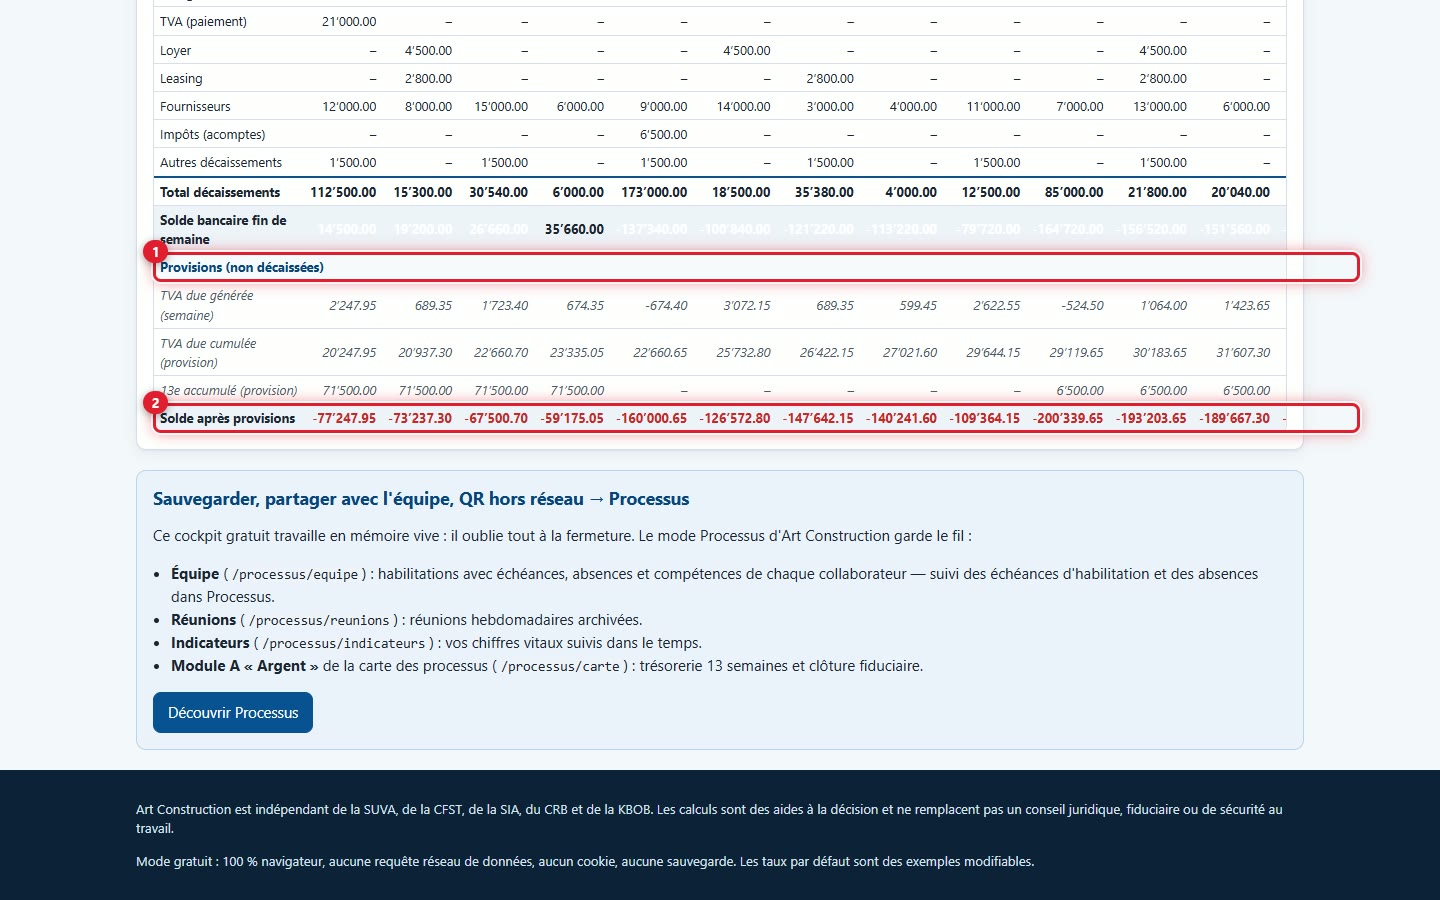
(1) The rows under Provisions show what is due but not yet paid: the due VAT generated each week, accumulated due VAT and accumulated 13th salary. (2) Balance after provisions is the bank balance minus accumulated due VAT and accumulated 13th salary.
20Export or print cash flow
Export cash flow forecast (1) downloads an A4 landscape PDF. Print (2) opens your browser print window.
21The cash flow PDF
Page 1 gives the summary (opening balance, threshold, lowest balance, first week below the threshold, survival days) and the complete table. Page 2 gives the chart and assumptions text: salaries, 13th salary, social security contributions, VAT and periods. Each page bears the watermark « Free version - art-construction.ch ».
4. 1-Page Plan
The 1-Page Plan fits on a single sheet: the 3-year vision, the annual objectives, the quarter priorities and five figures to track every week.
22Filling in the company, vision and objectives
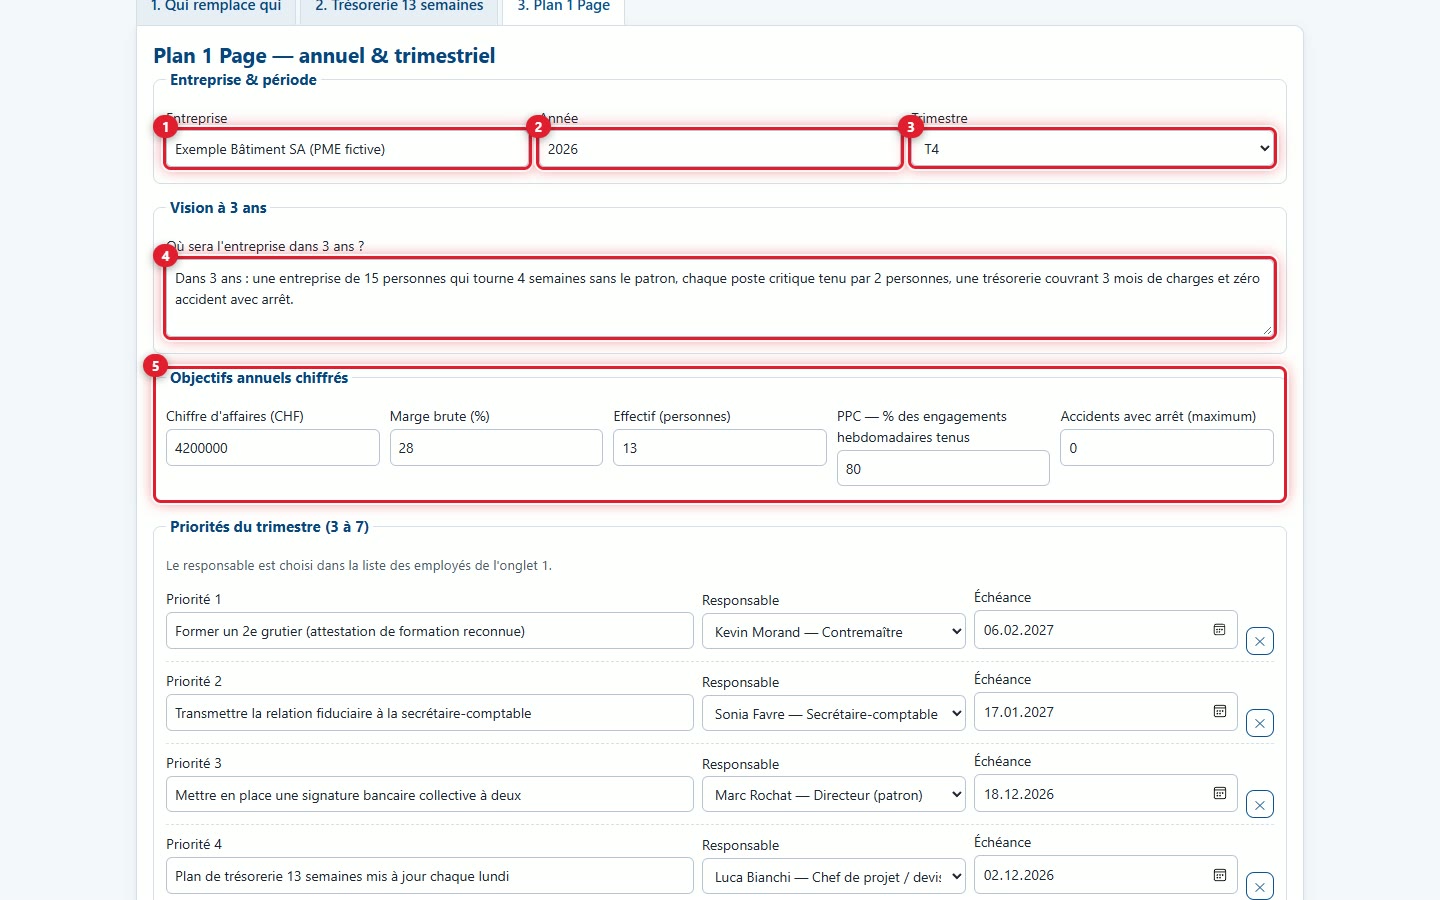
(1) The company name, (2) the year and (3) the quarter (Q1 to Q4). (4) The 3-year vision, in 600 characters maximum. (5) Five quantified annual objectives: turnover (CHF), gross margin (%), headcount, PPC (percentage of weekly commitments kept, in %) and the maximum number of accidents resulting in time off work.
23Setting the quarter priorities
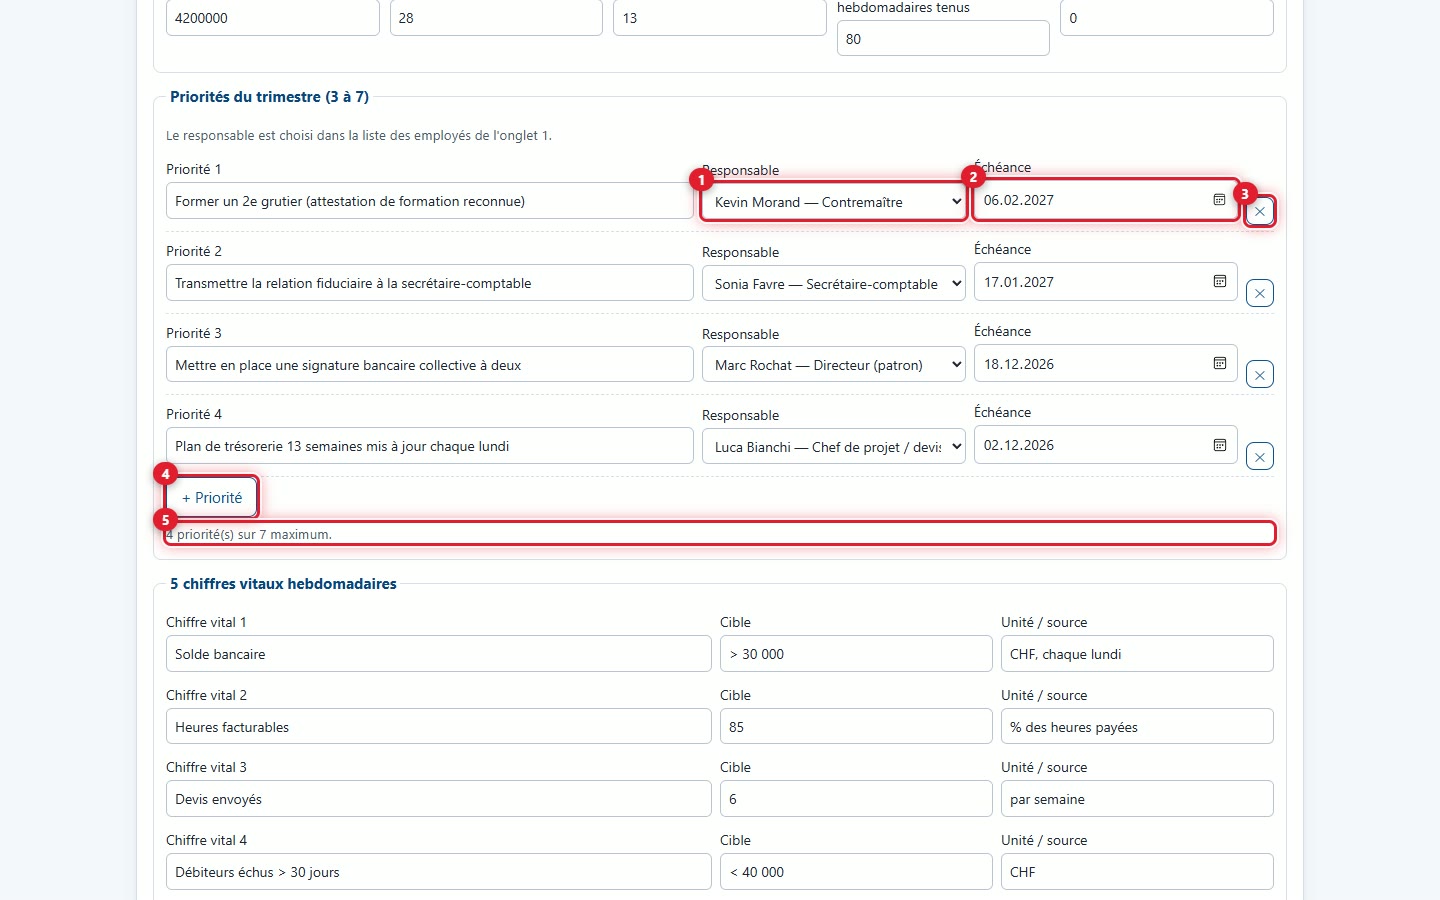
You need 3 to 7 priorities. (1) The person in charge is chosen from the list of people in the matrix. (2) Choose the deadline. (3) The ✕ button deletes a priority: it remains disabled as long as there are only 3. (4) + Priority adds one, up to 7. (5) The counter shows how many priorities have been entered. The video shows how to add a priority with its person in charge.
24Choosing the 5 vital figures and exporting
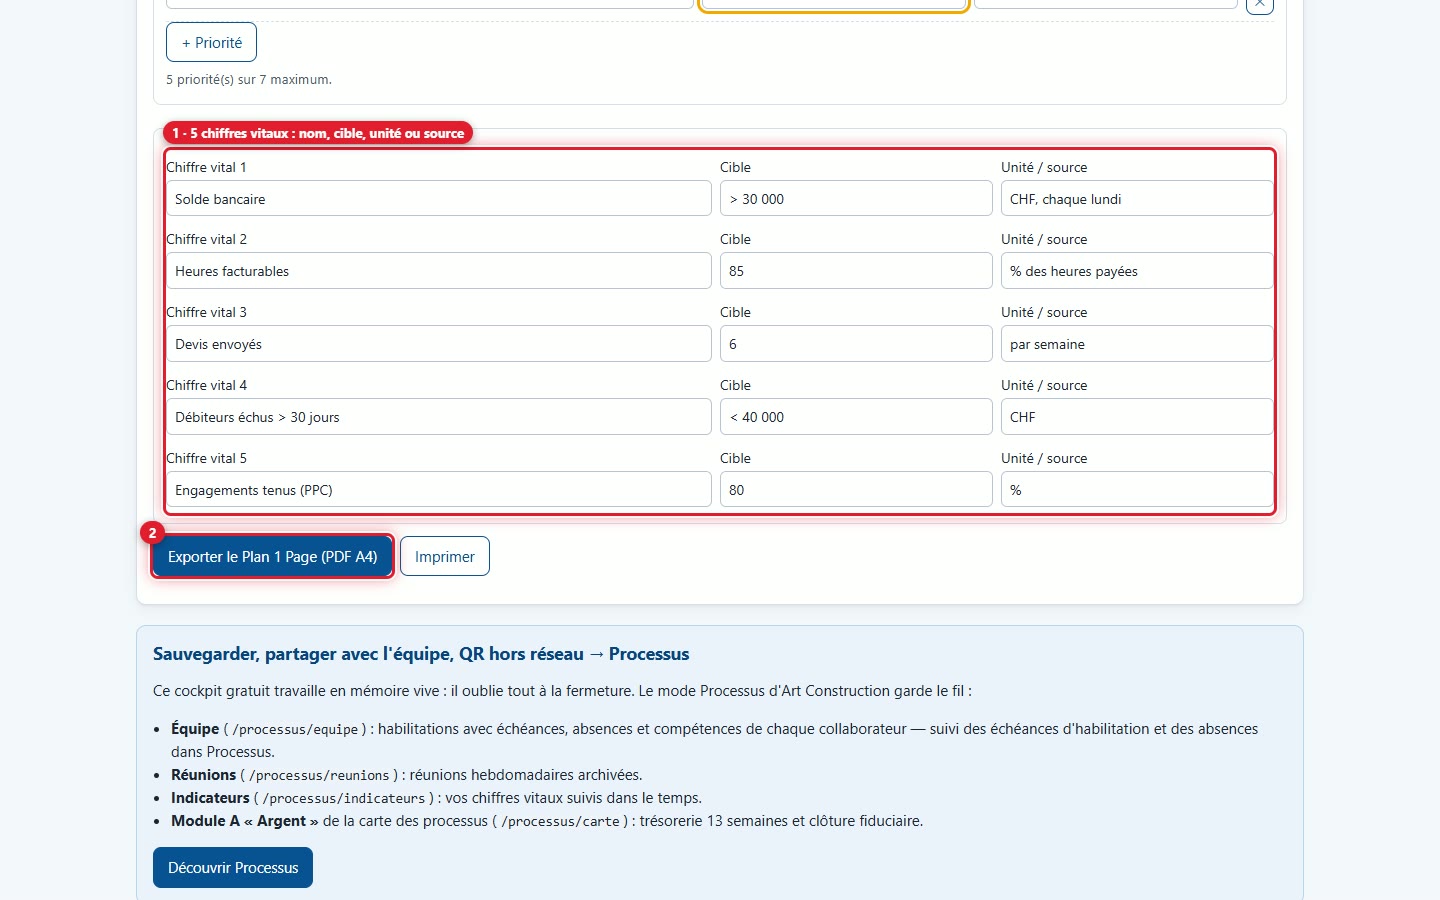
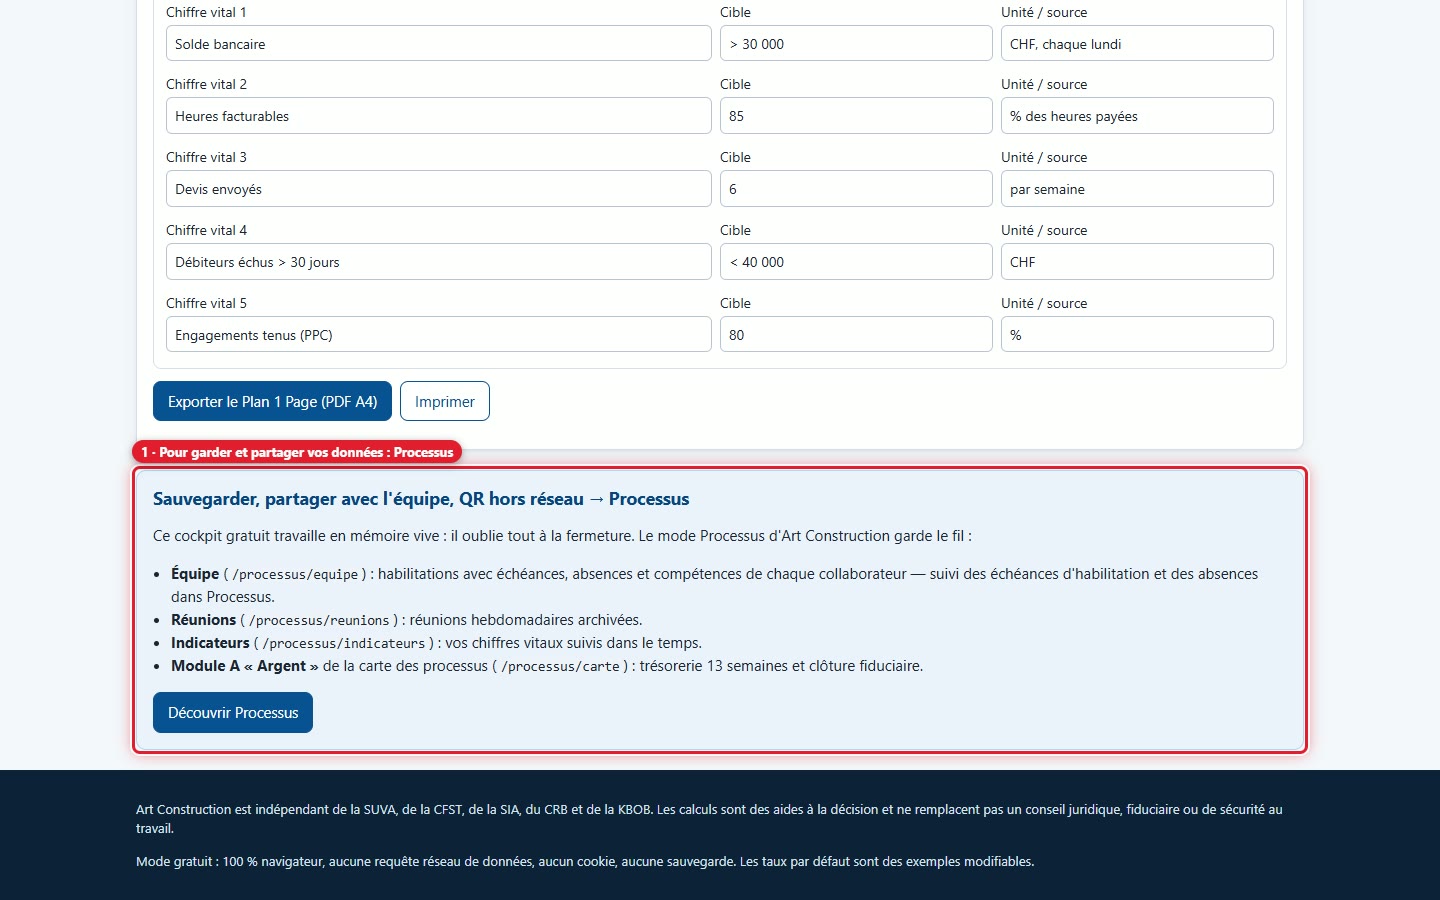
(1) Five rows: the name of the figure, its target and its unit or source, for example "every Monday". These are the figures you track every week. (2) Export the 1-Page Plan (PDF A4) downloads the plan as a PDF; Print opens the browser's print window.
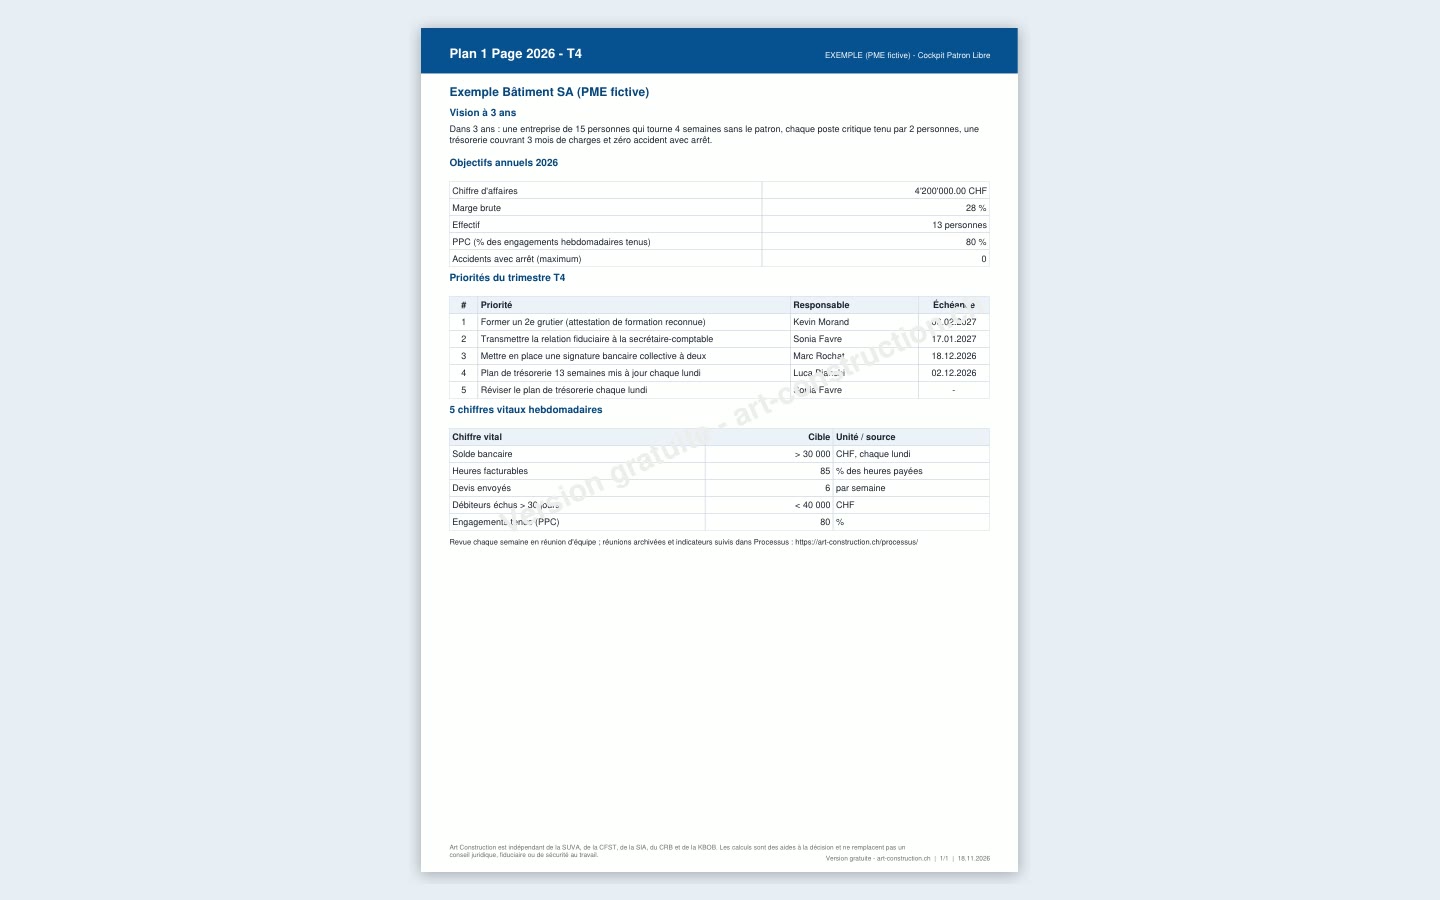
25The 1-Page Plan PDF
The PDF fits on a single portrait A4 page: the company, vision, objectives, priorities with their person in charge and deadline, then the vital figures. Only filled-in rows are printed.
5. Saving and sharing your data
26Going further with Processus
The free Owner Cockpit works in random-access memory: it forgets everything when closed. The bottom block of the page (1) presents Processus, the Art Construction software that keeps track: qualifications with deadlines and absences for each employee, archived weekly meetings, indicators tracked over time and the "Money" module of the process map. The Discover Processus button opens its page.
6. What this software does not do
- It saves nothing and sends nothing: closing or reloading the page erases everything. Export to PDF before leaving.
- It imports no files and has no link with your bank, accounting or Excel spreadsheet: all figures are entered manually. It only exports to PDF or when printing, not to Excel or CSV.
- It does not replace fiduciary or legal advice, nor occupational safety advice: its calculations are decision-making aids. The proposed social security contribution rates and TDFN are examples to be replaced.
- It calculates VAT at the single standard rate of 8.1%, on cash inflows including VAT, with payment 60 days after the end of the period: no reduced rate, no actual settlement.
- It counts gross salary as an outflow on the payday and social security contributions as a single percentage total: no payslip, no special cases.
- Its matrix has four levels, a fixed threshold of two autonomous people and a fixed 30-day alert: these settings cannot be changed. It tracks neither absences nor holidays.
- Its 1-Page Plan has five vital figures and 3 to 7 priorities: it does not track these figures over time.
- It has no account, no sharing and no multi-user work: it lives in your browser tab.
- In the PDF, some Croatian and Turkish letters (č, ć, đ, ş, ğ, ı…) are replaced by the base letter.
A question? Send a request to support.